10
Resampling
Tidy Data Science with the Tidyverse and Tidymodels
W. Jake Thompson
https://tidyds-2021.wjakethompson.com · https://bit.ly/tidyds-2021
Tidy Data Science with the Tidyverse and Tidymodels is licensed under a Creative Commons Attribution 4.0 International License.
Your Turn 0
- Open the R Notebook materials/exercises/10-resampling.Rmd
- Run the setup chunk
01:00
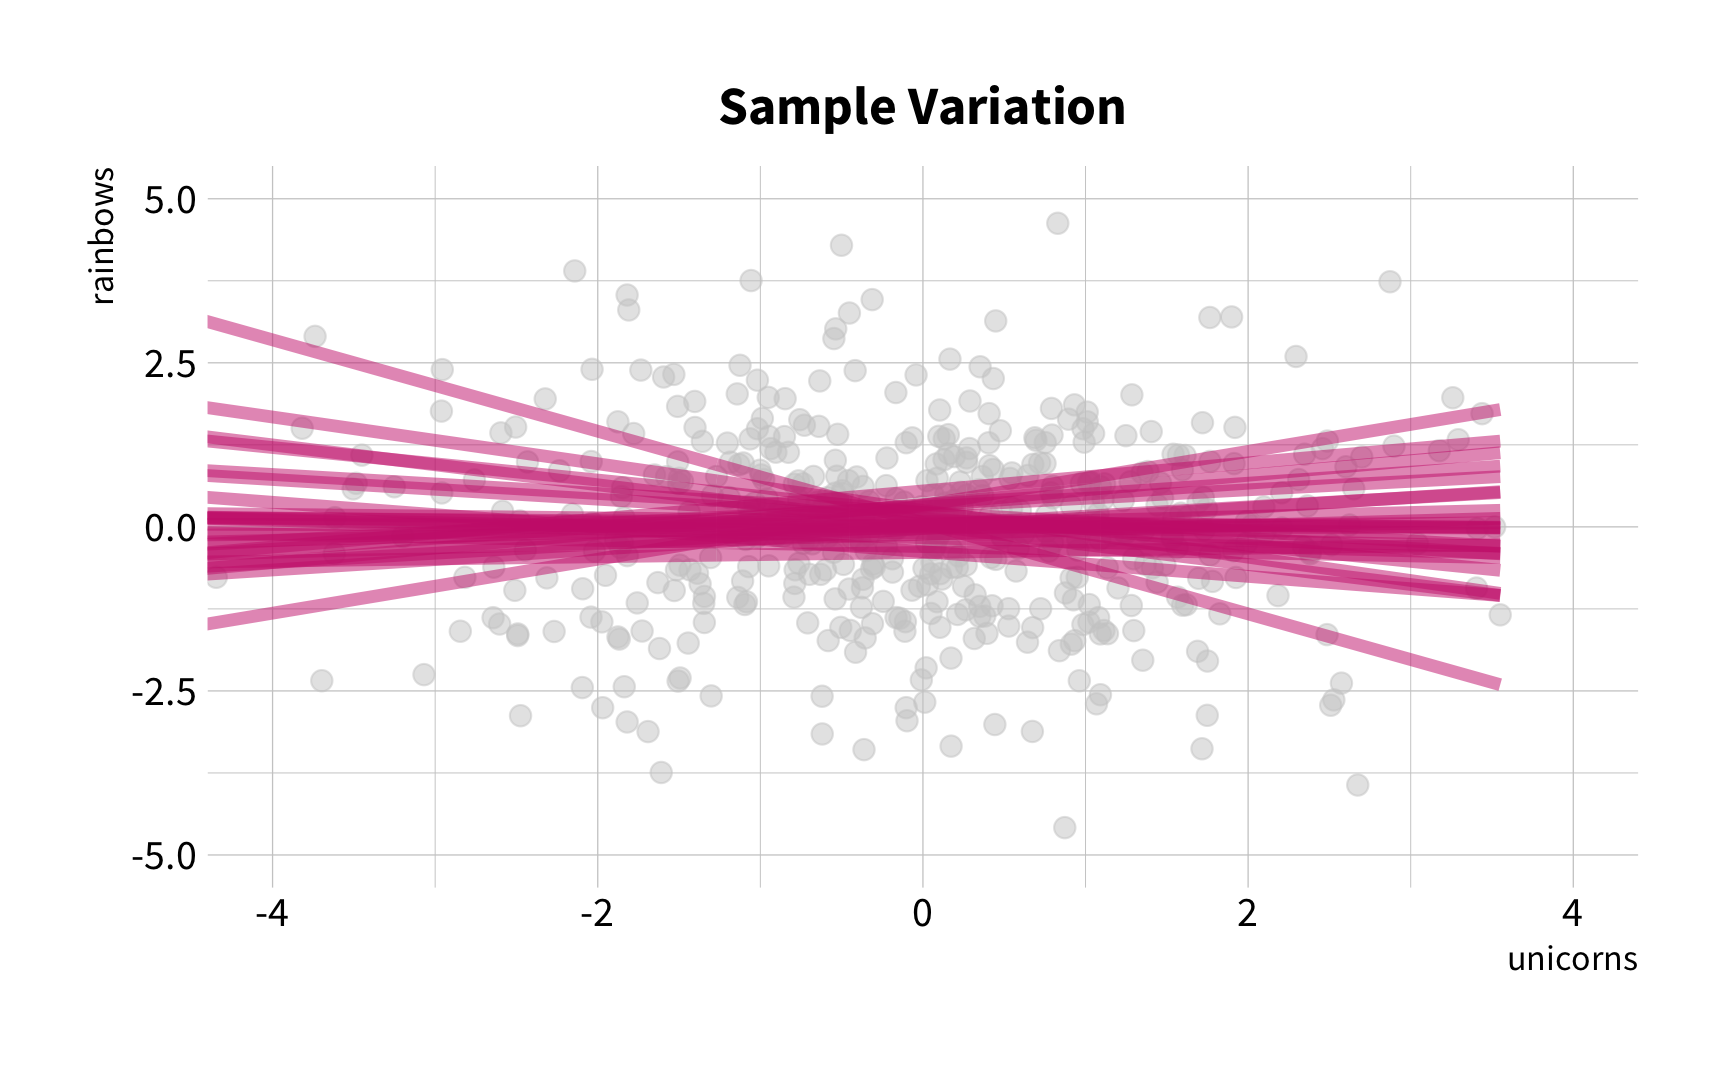
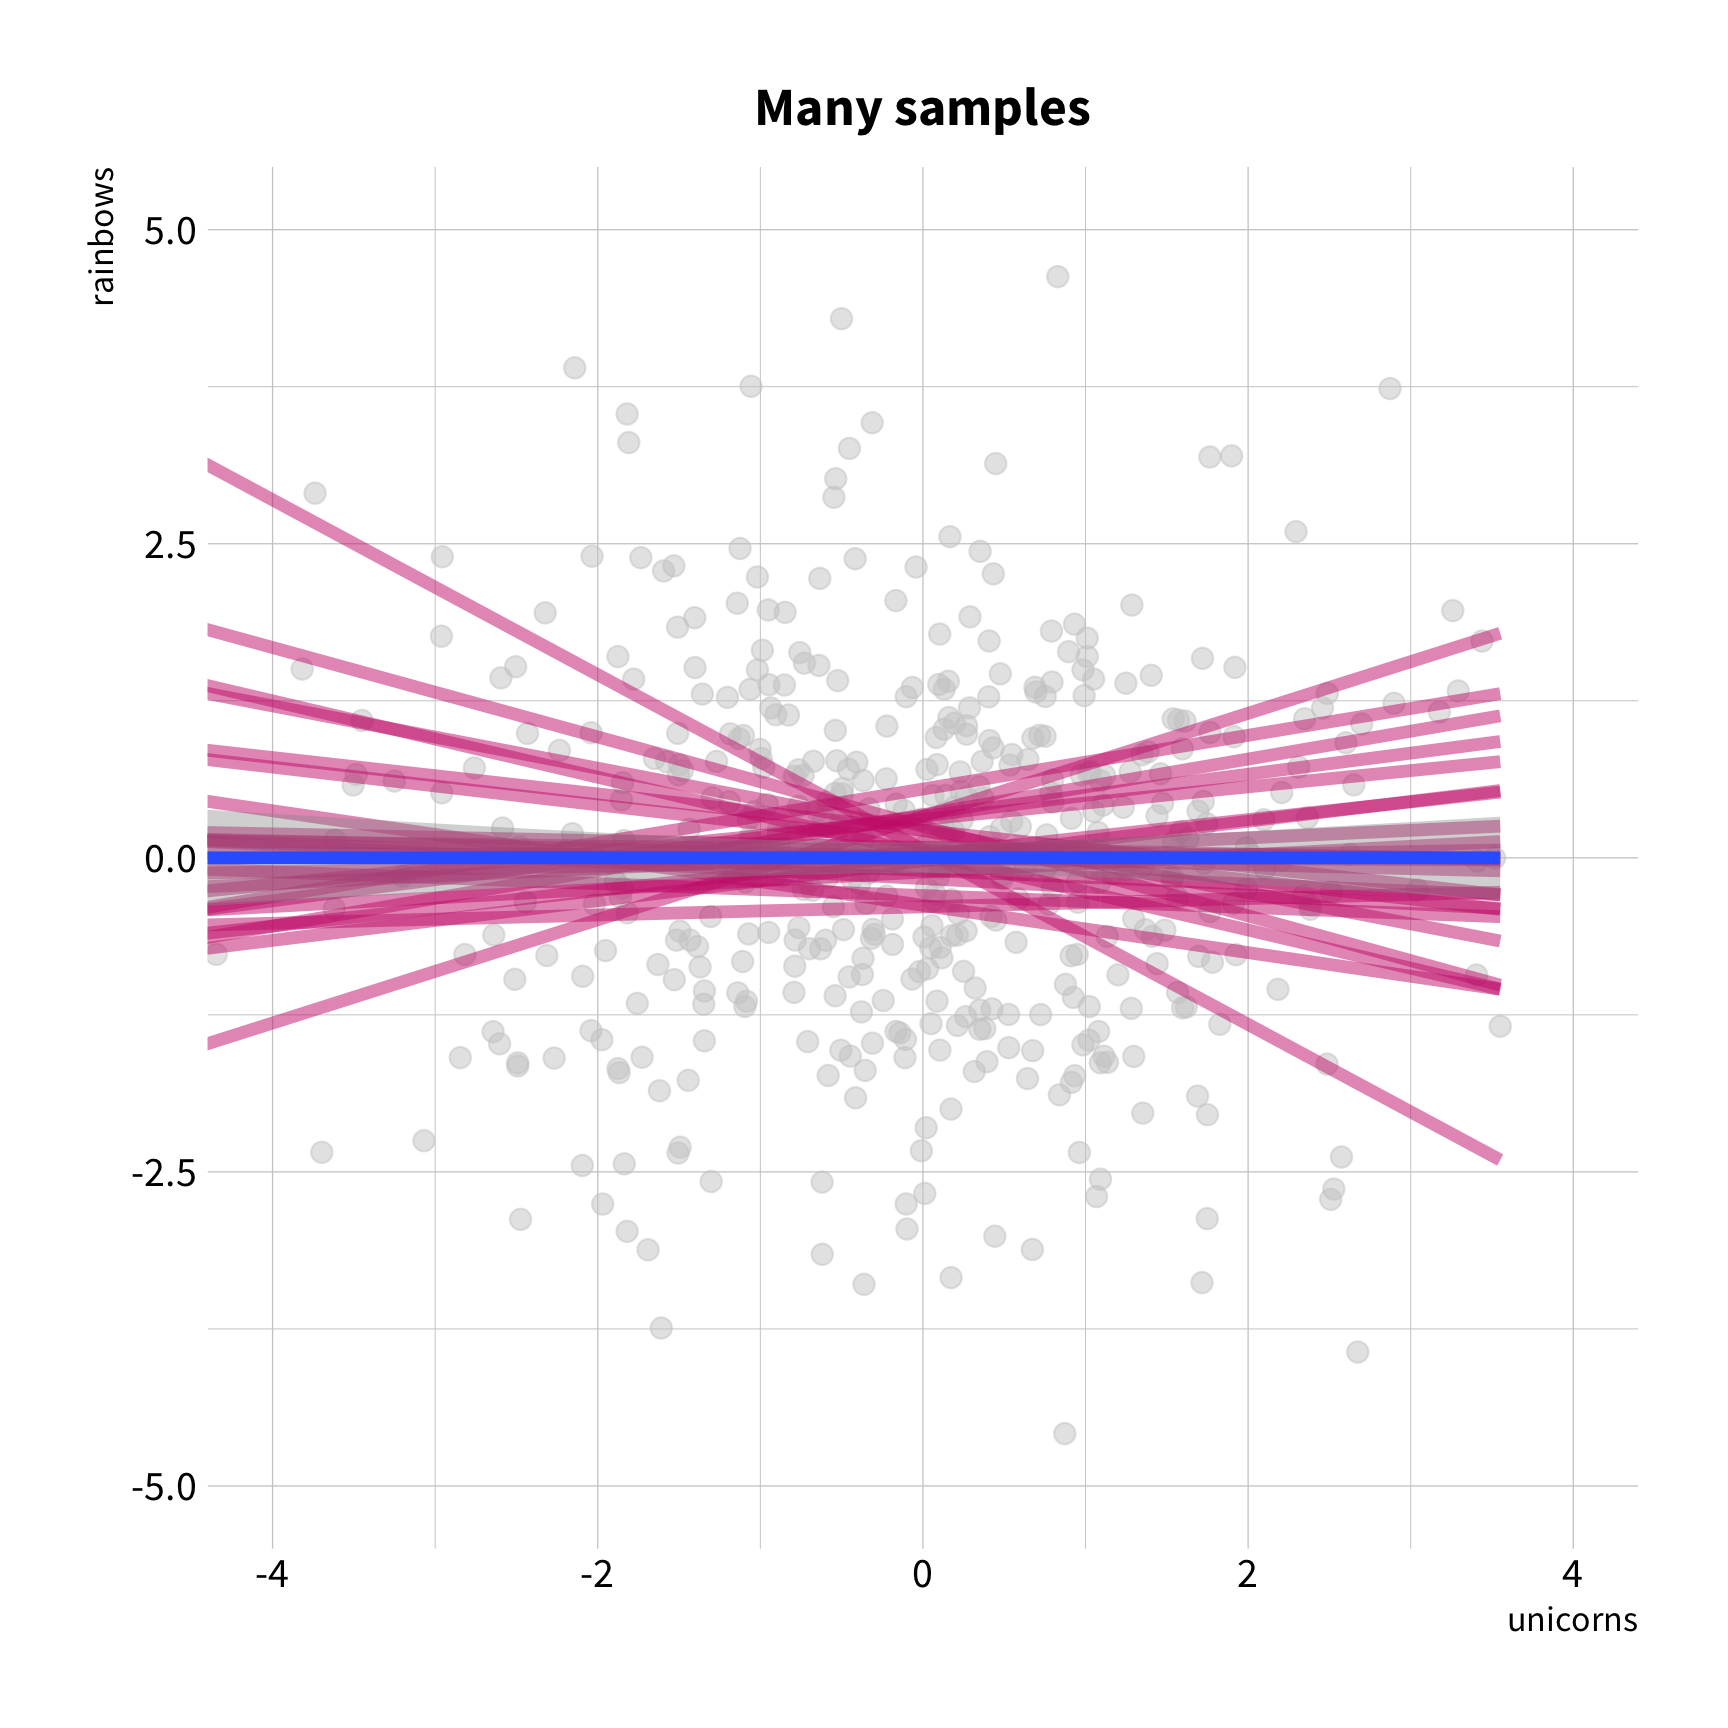
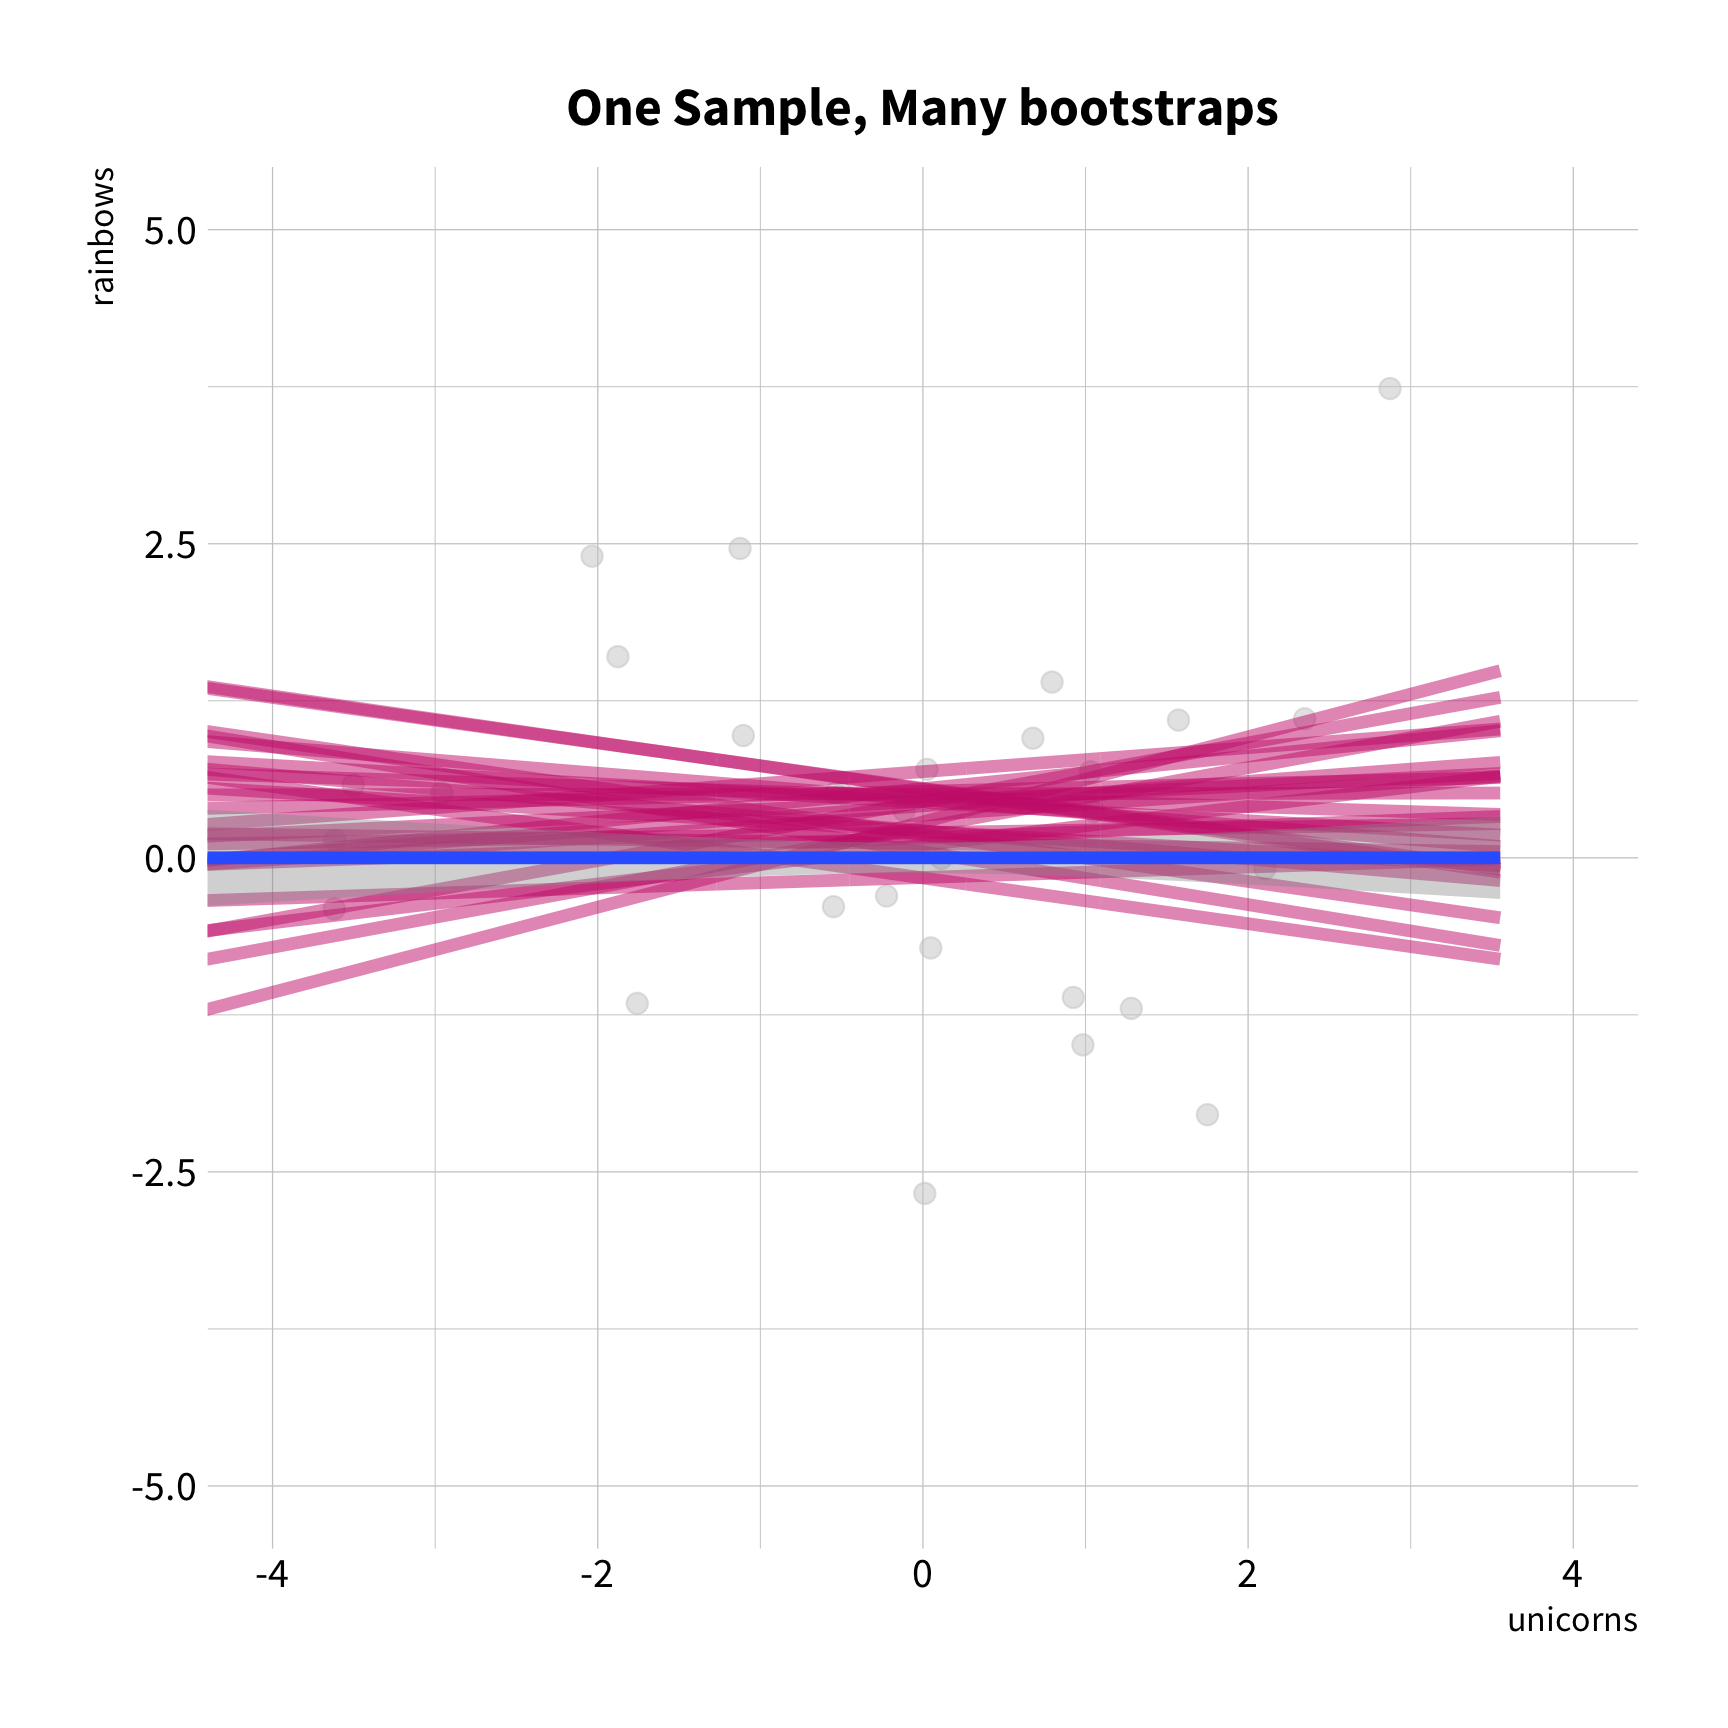
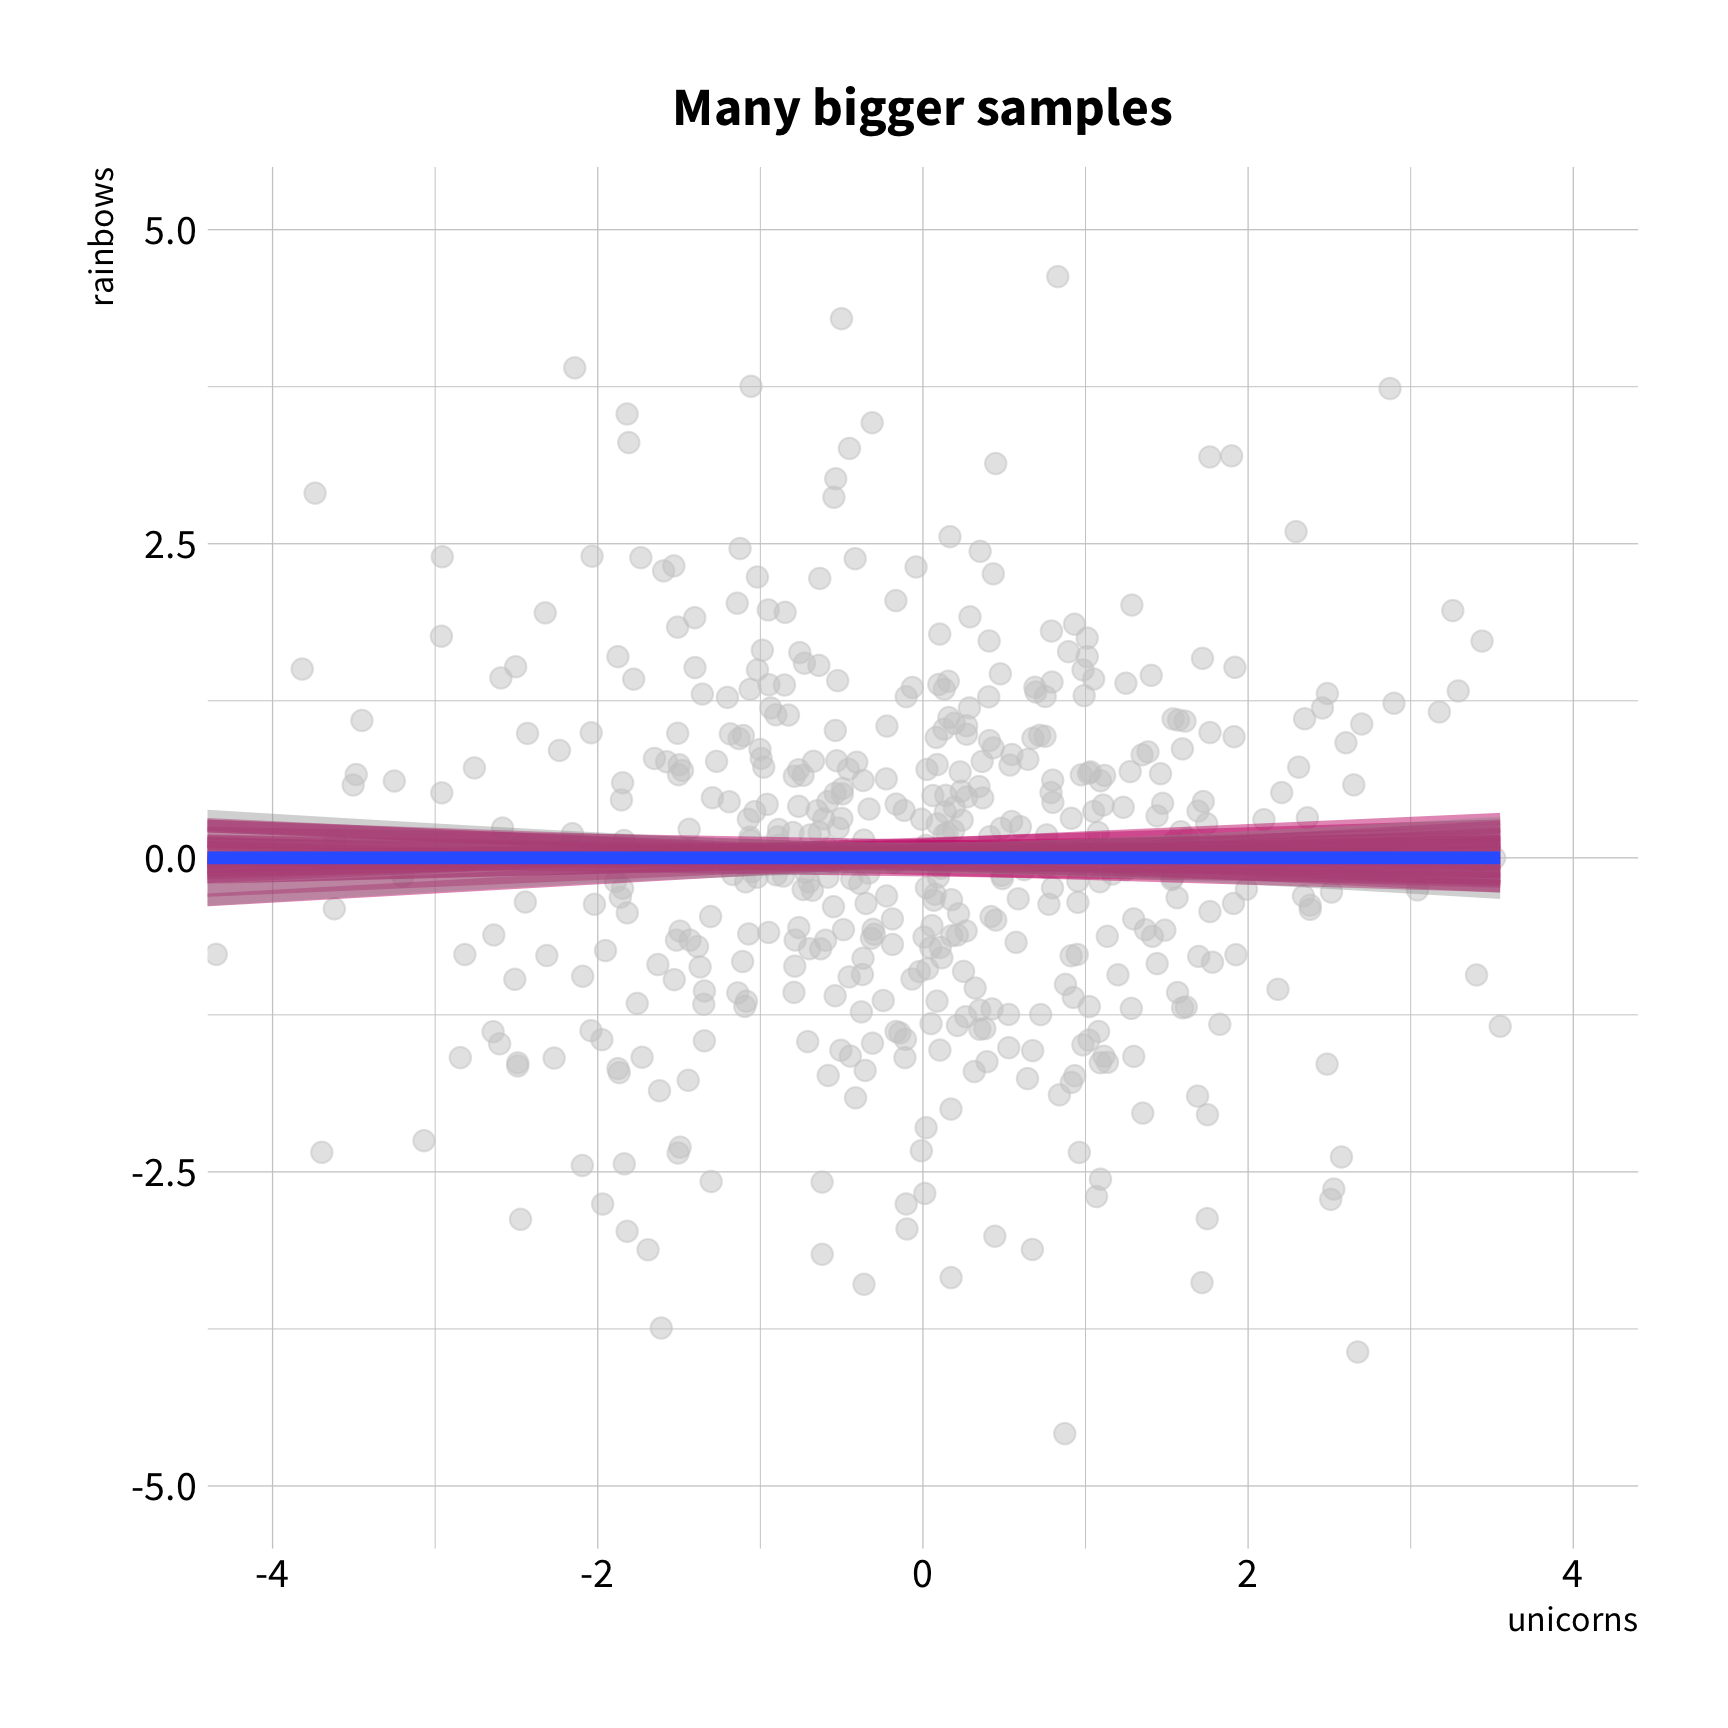
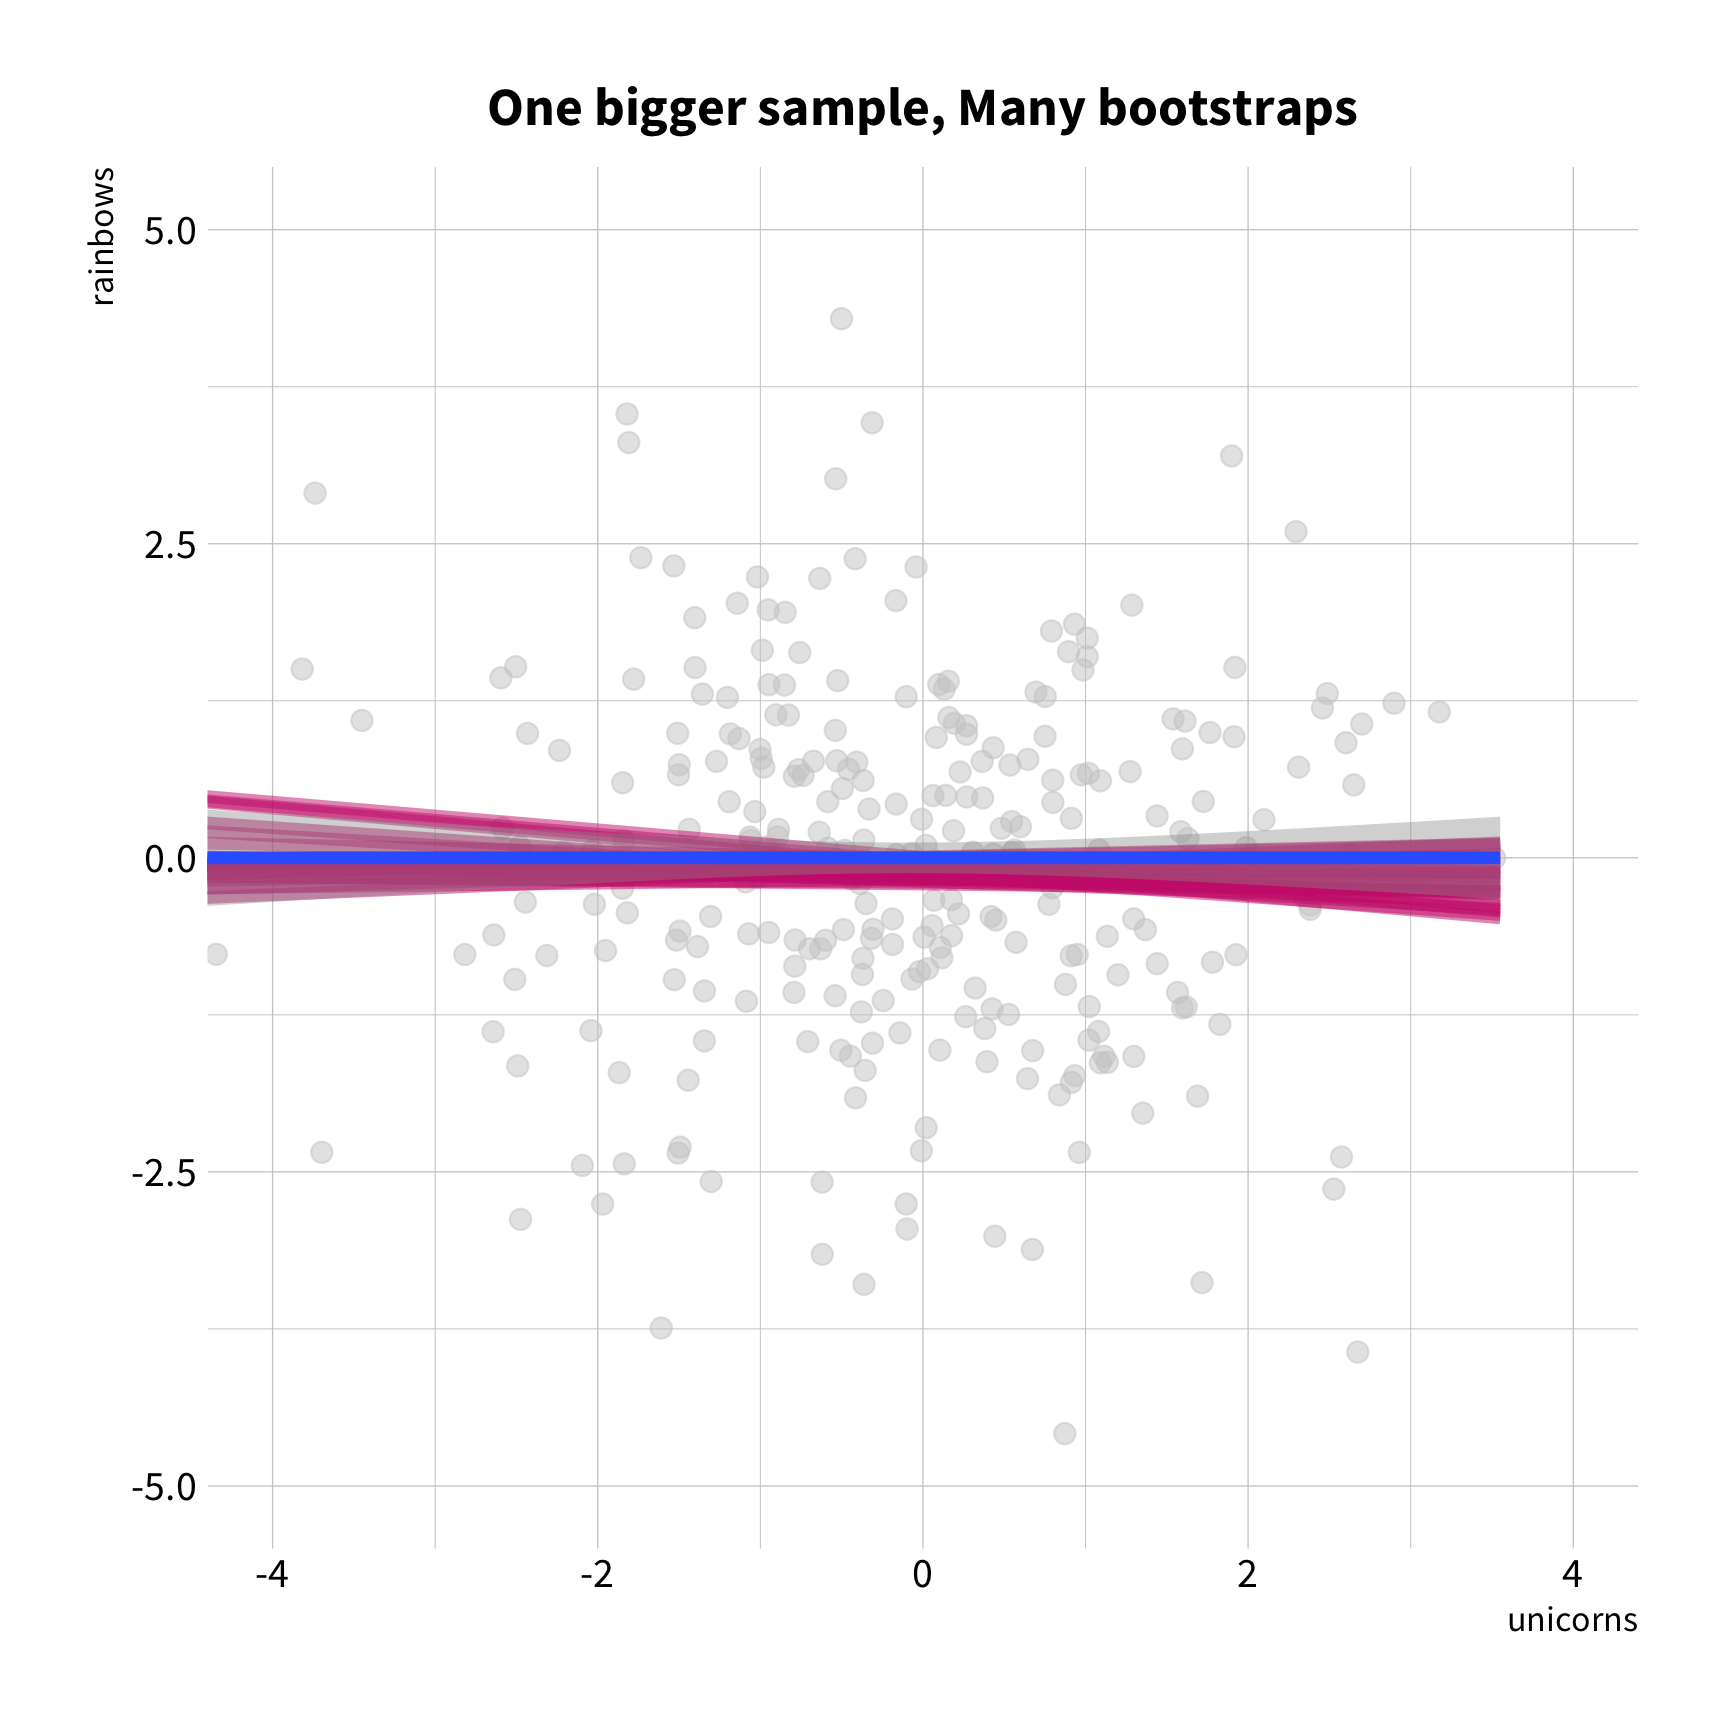
Hypothesis
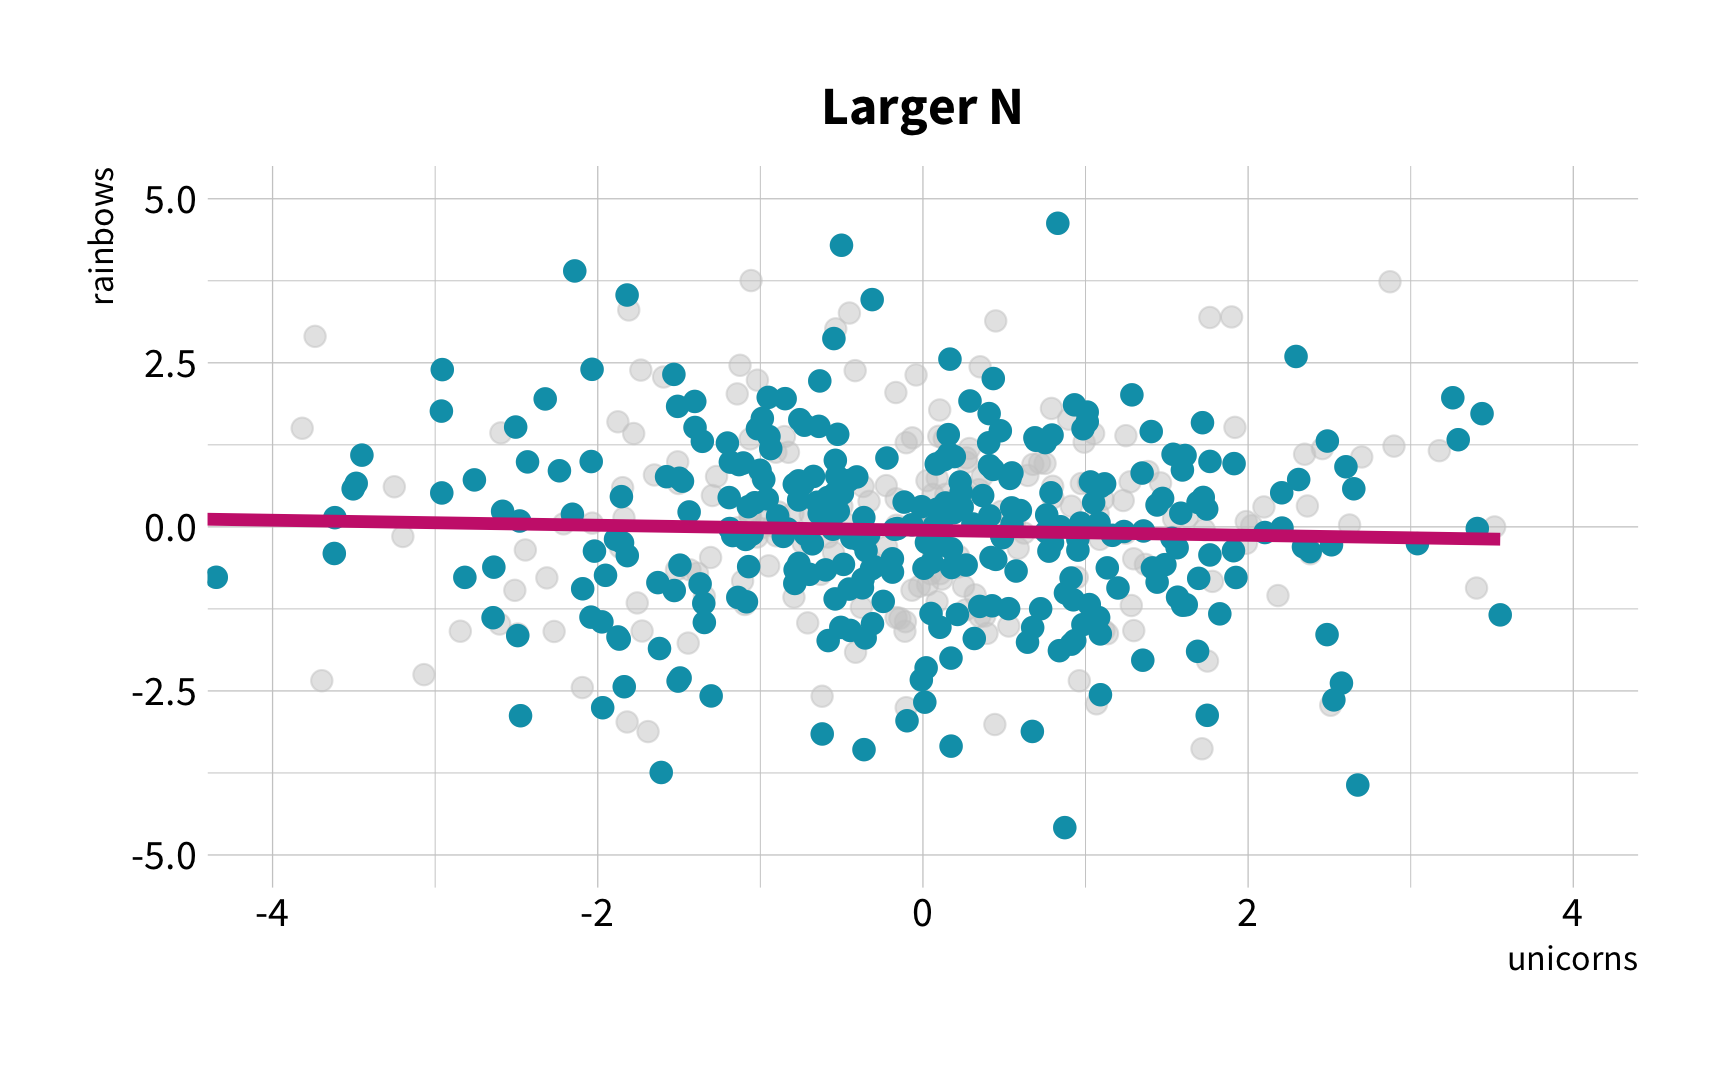
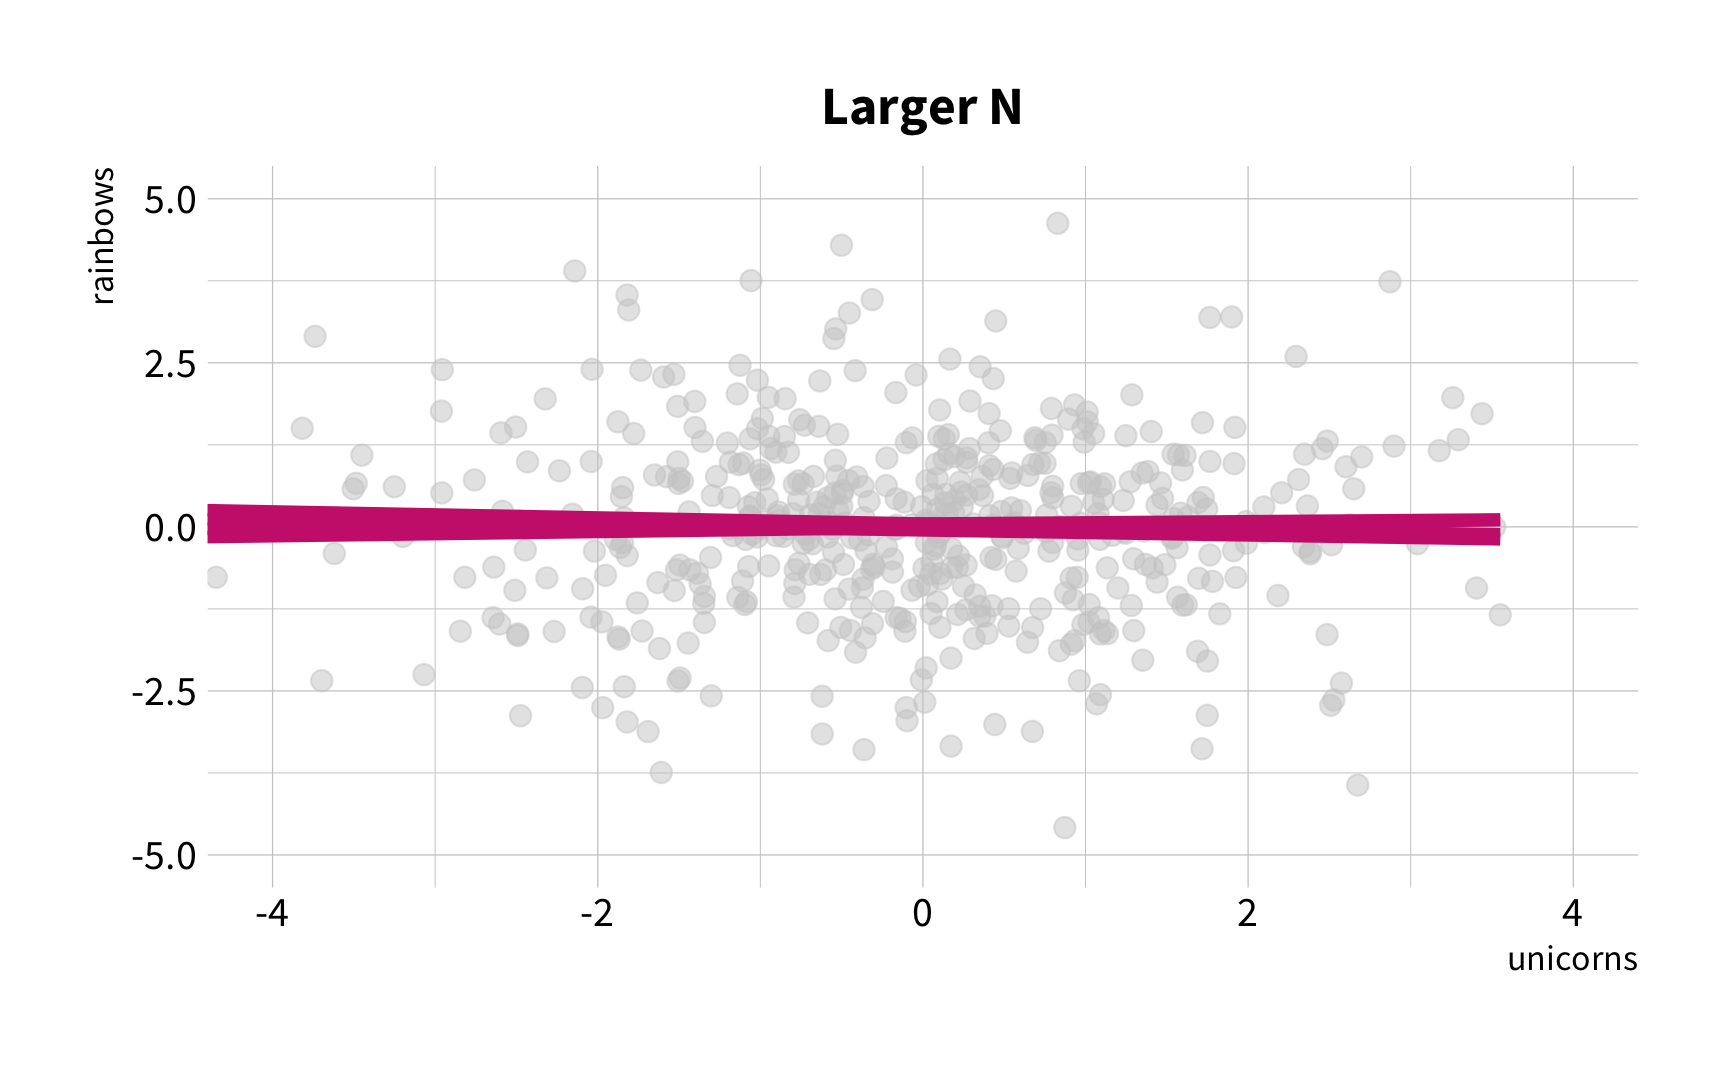
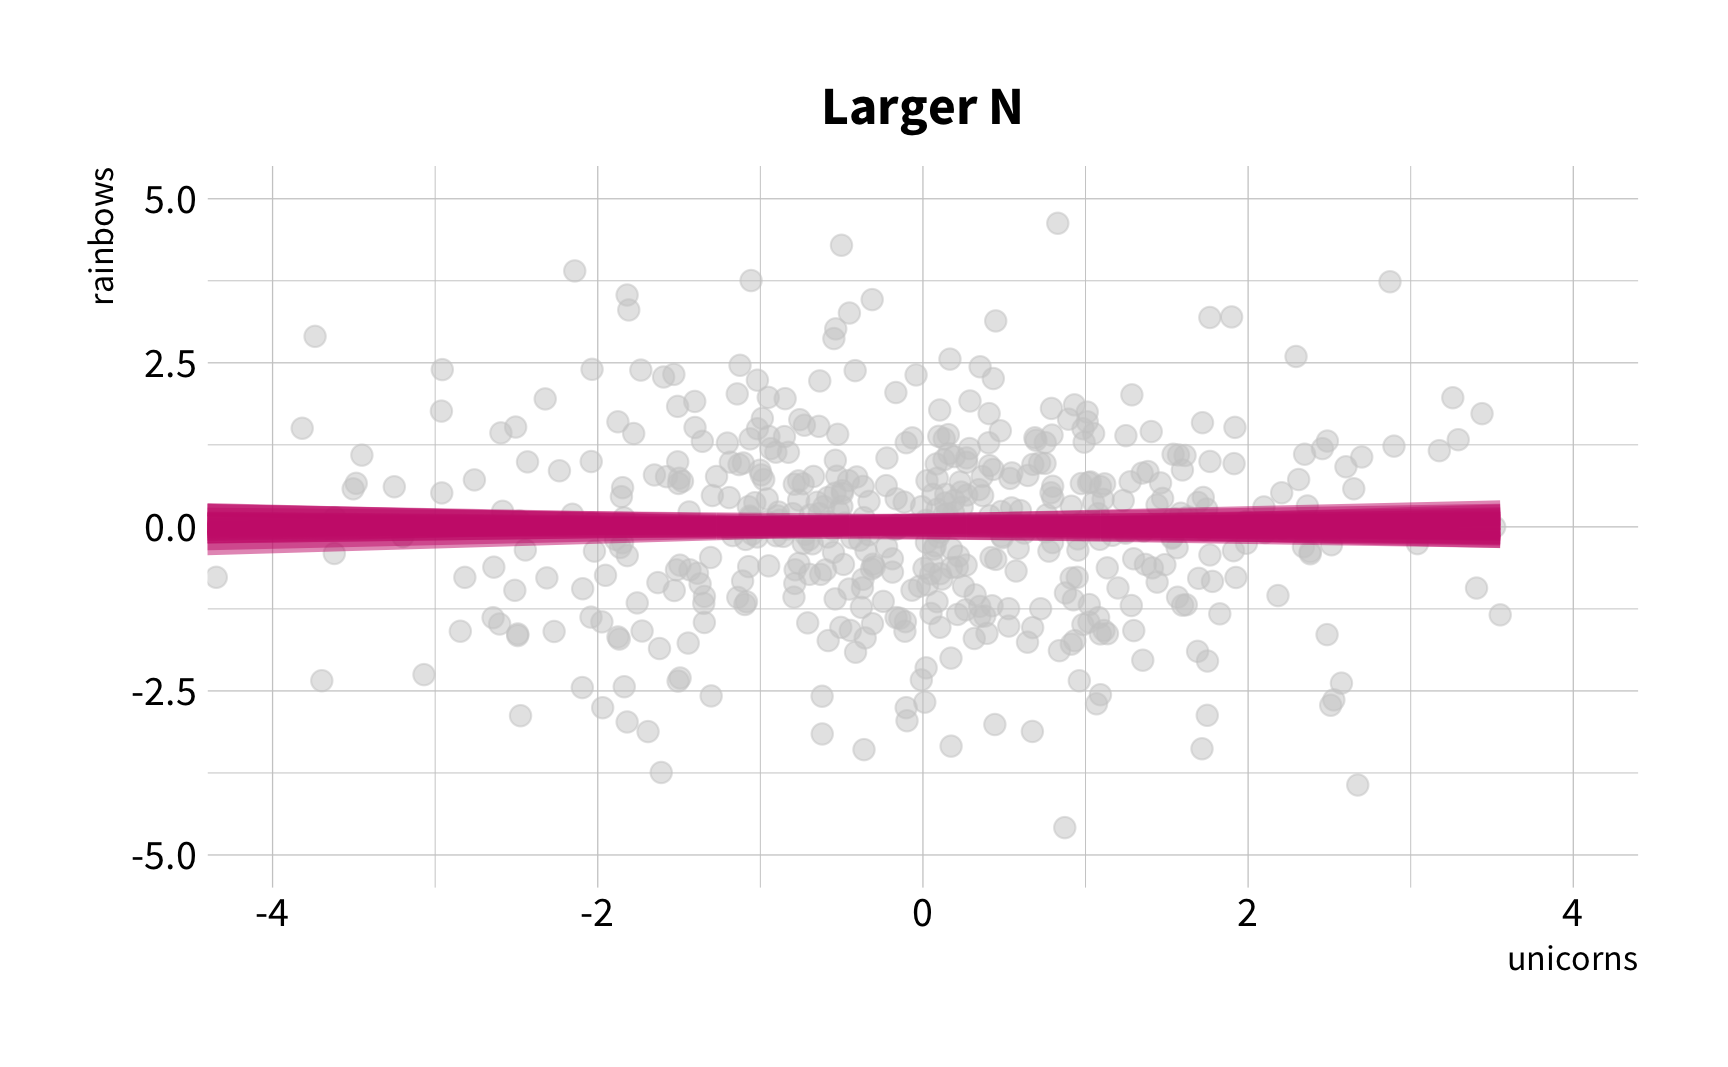
As the number of 🦄 increases, so does the number of 🌈.
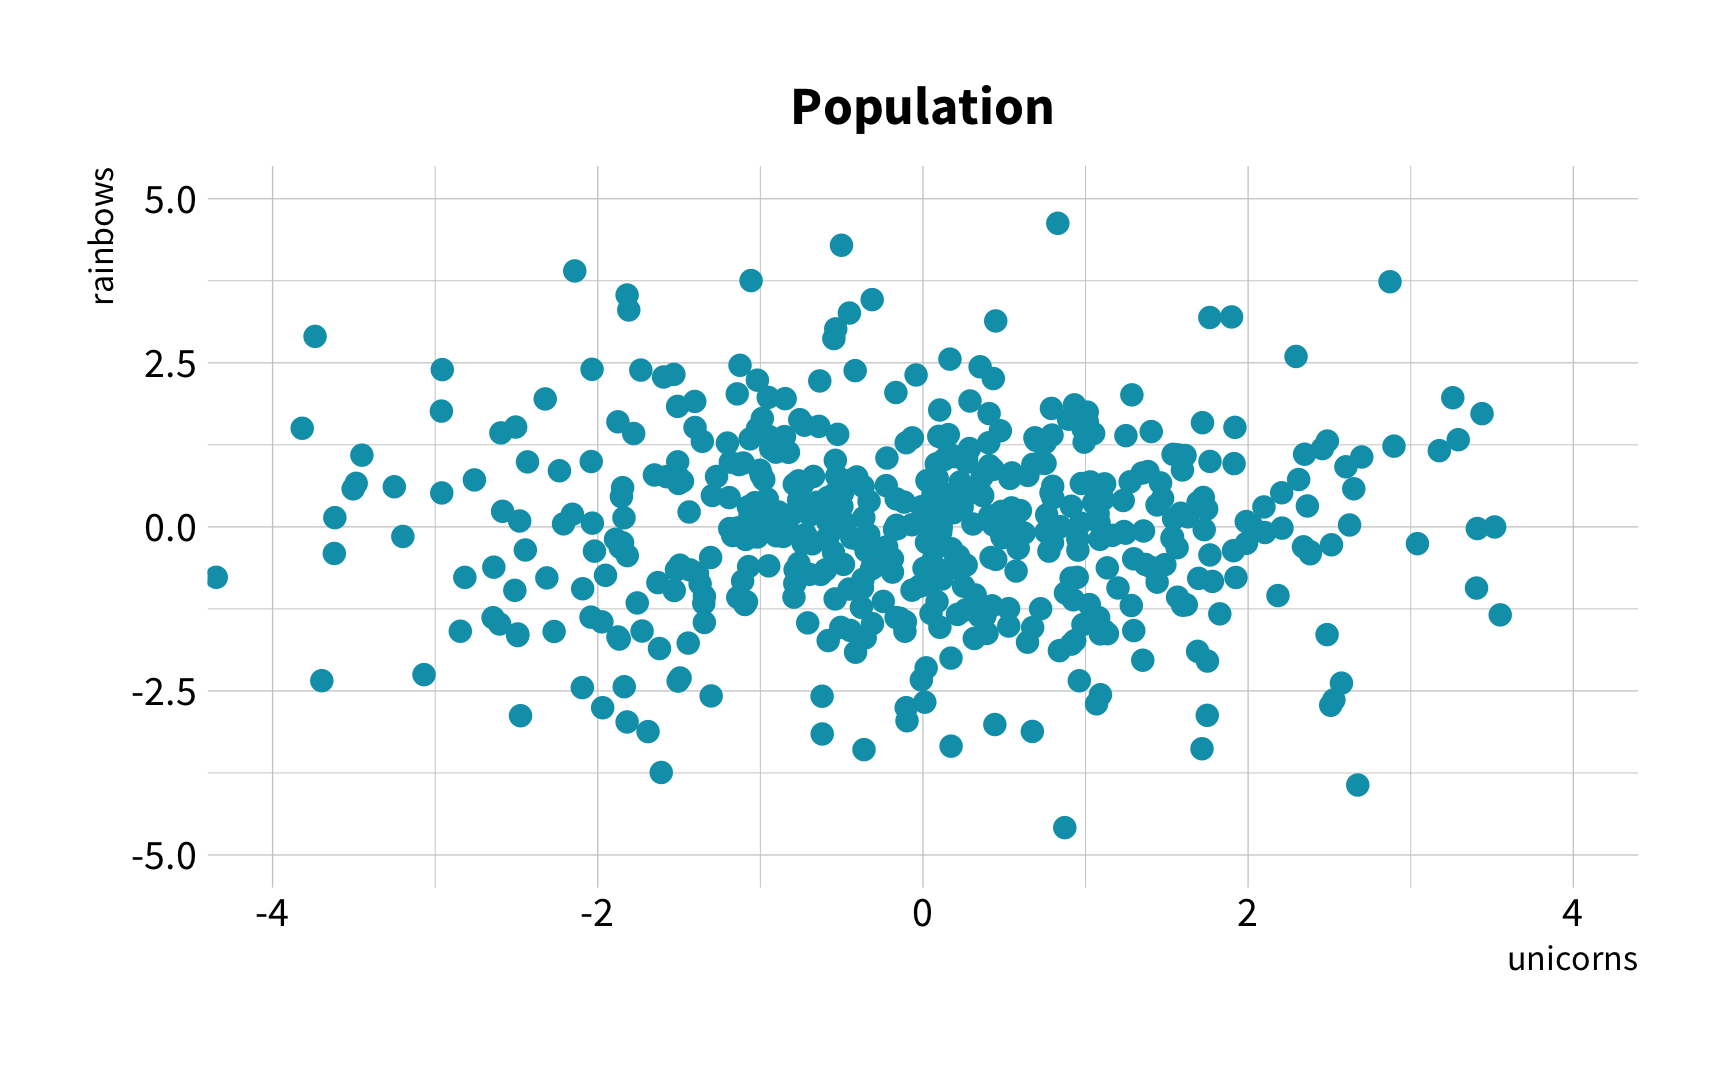
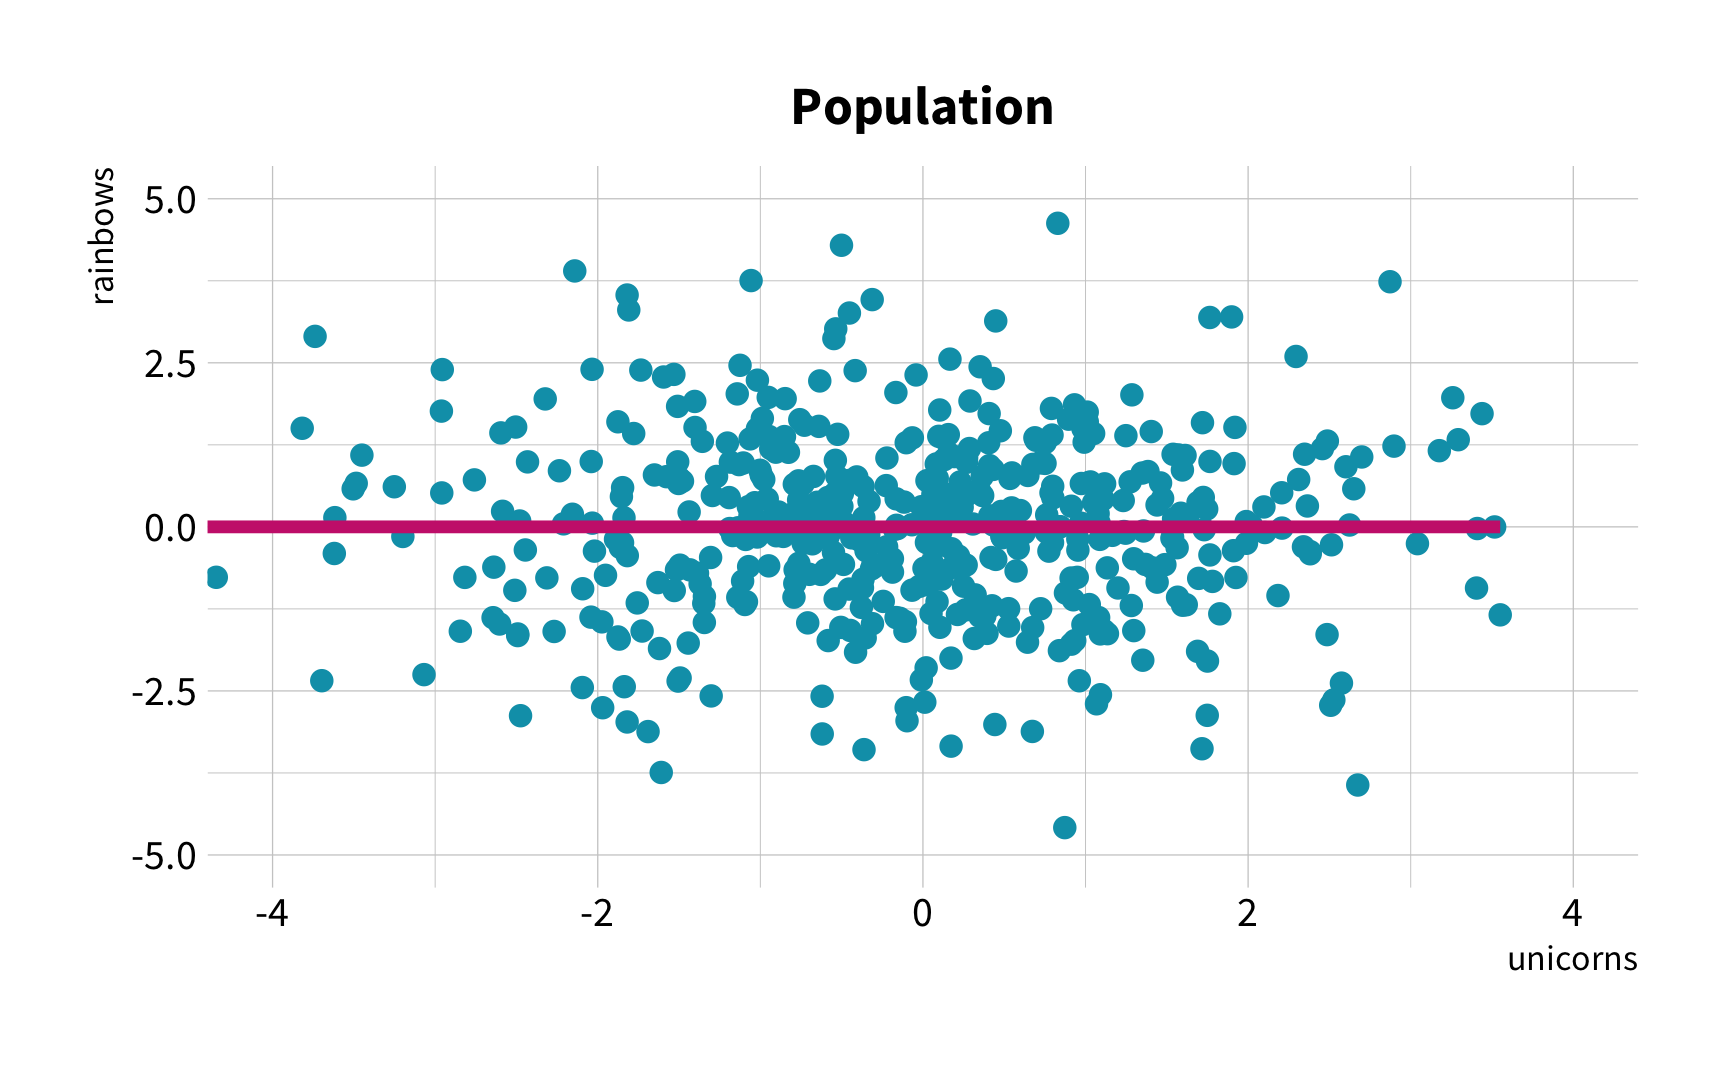
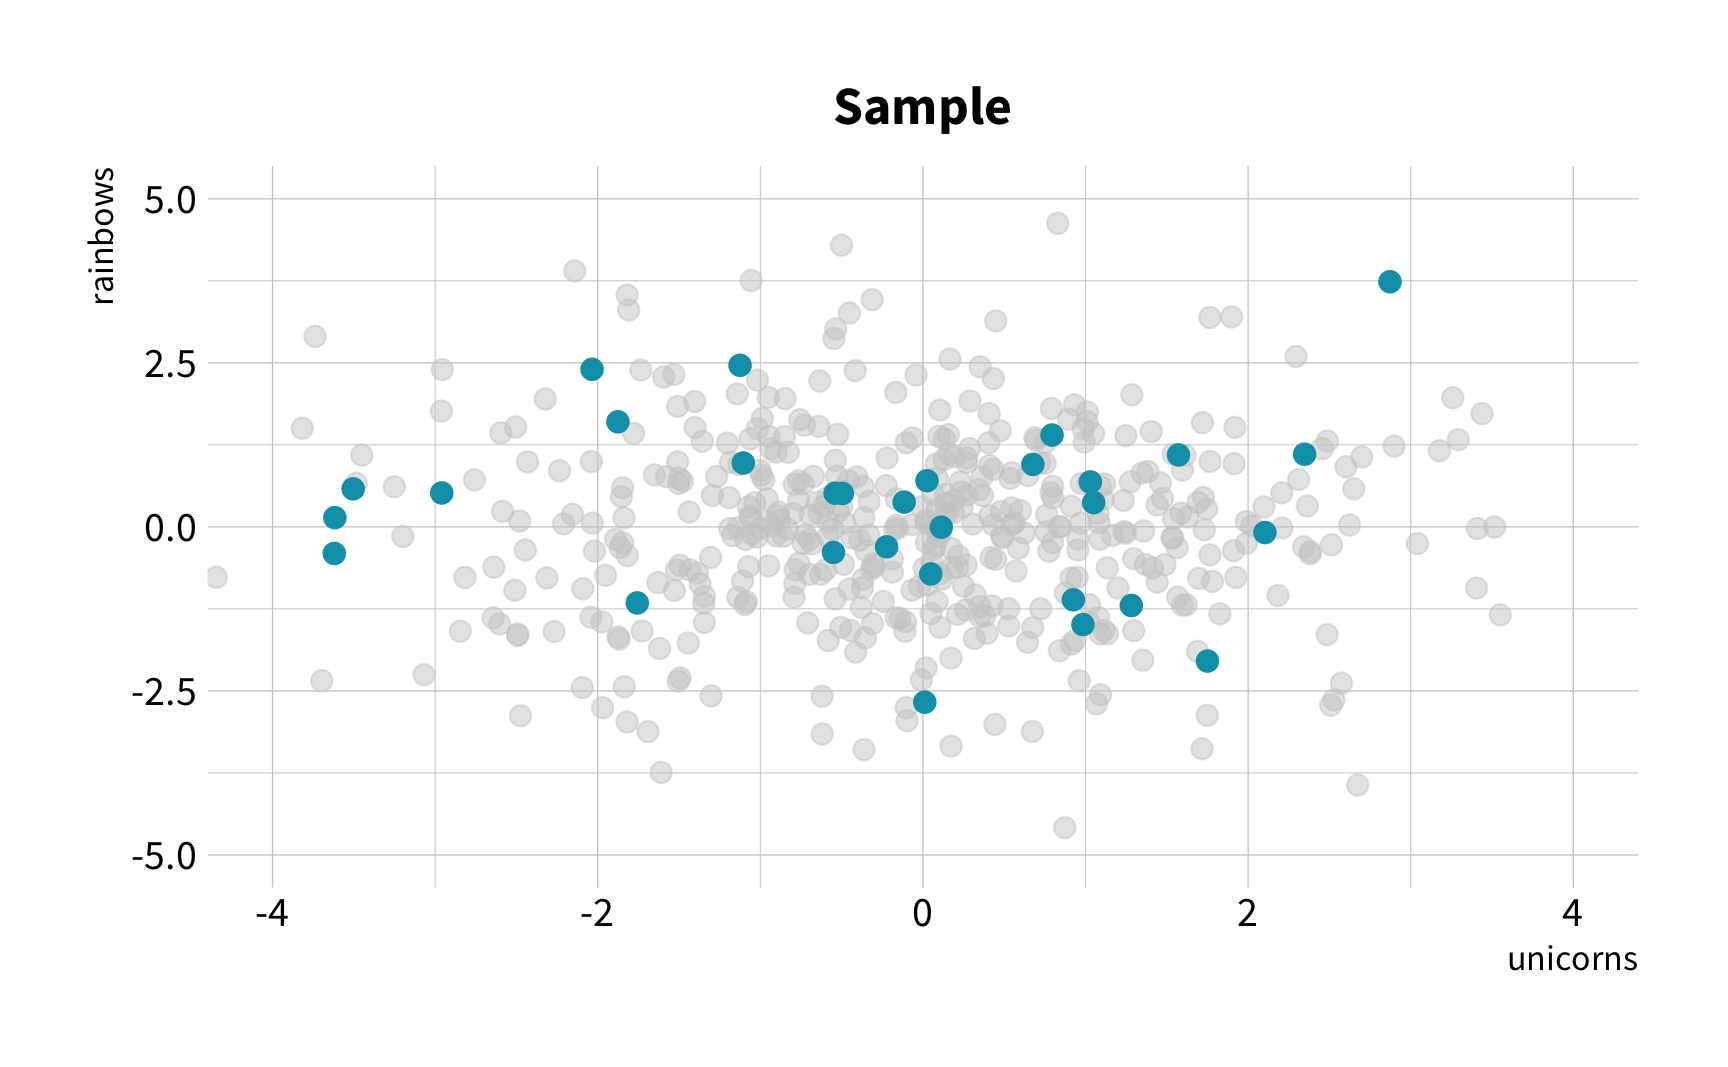
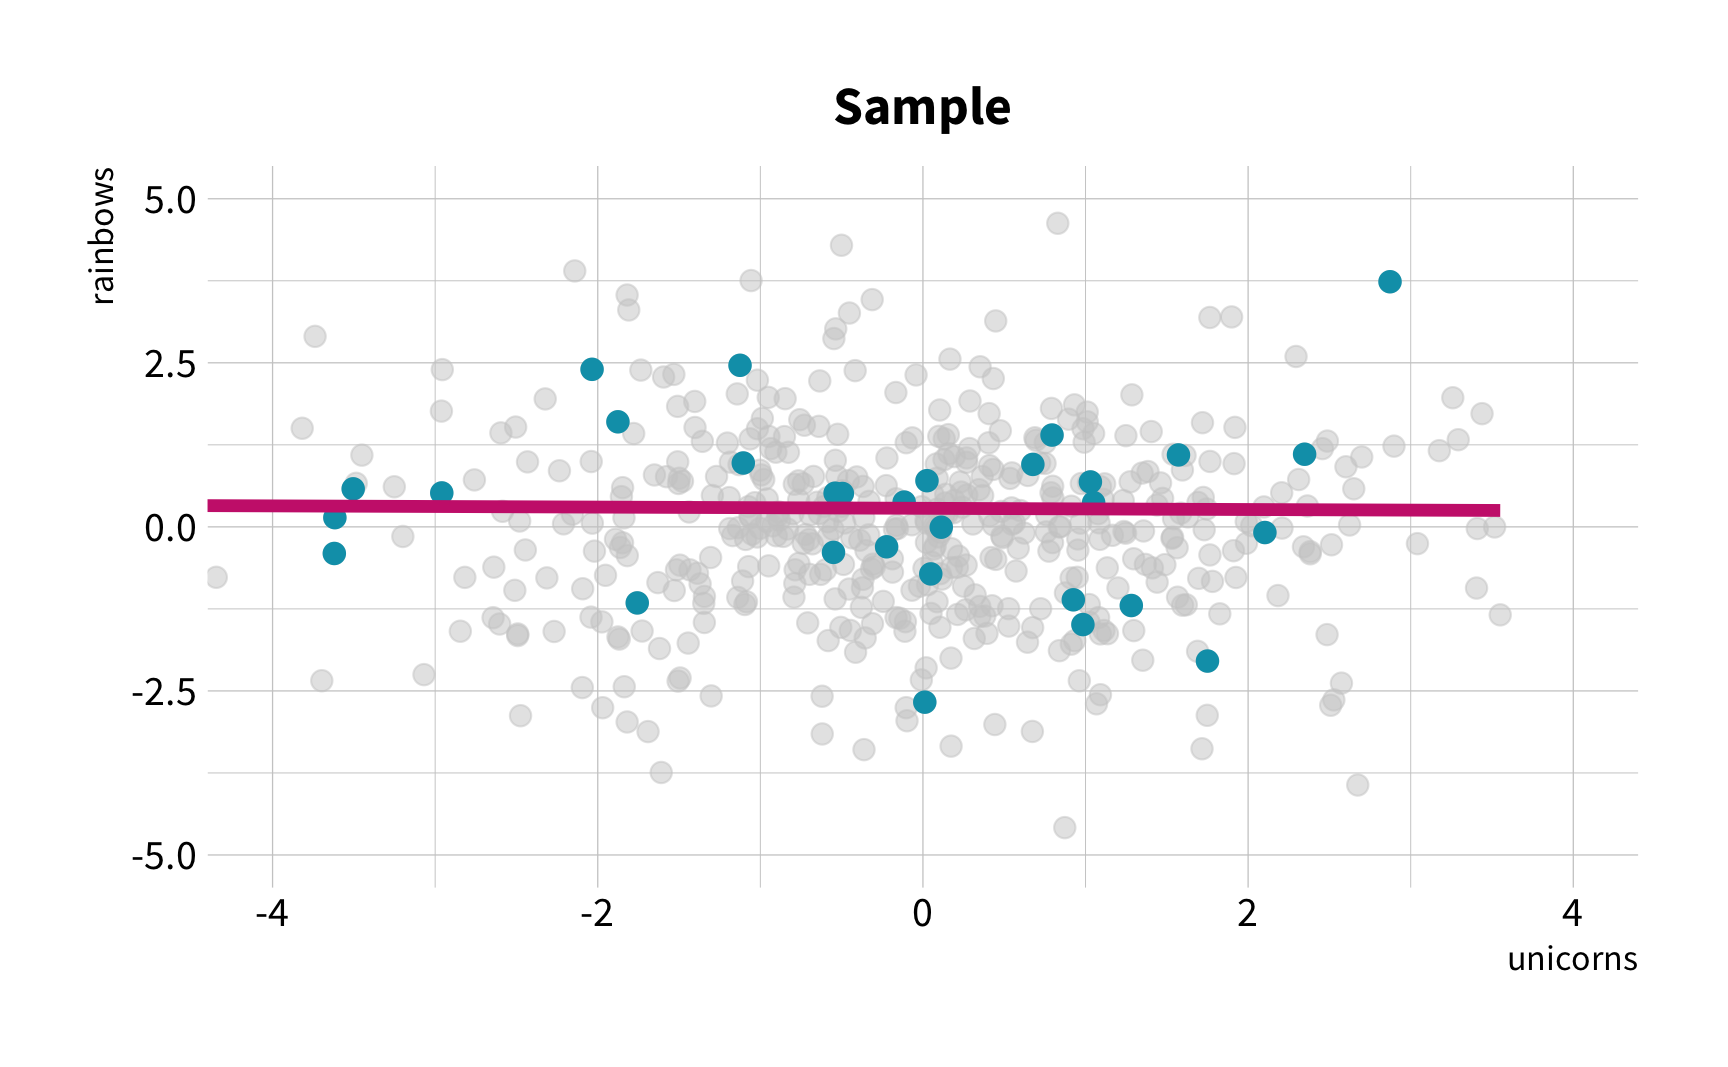
The Challenge
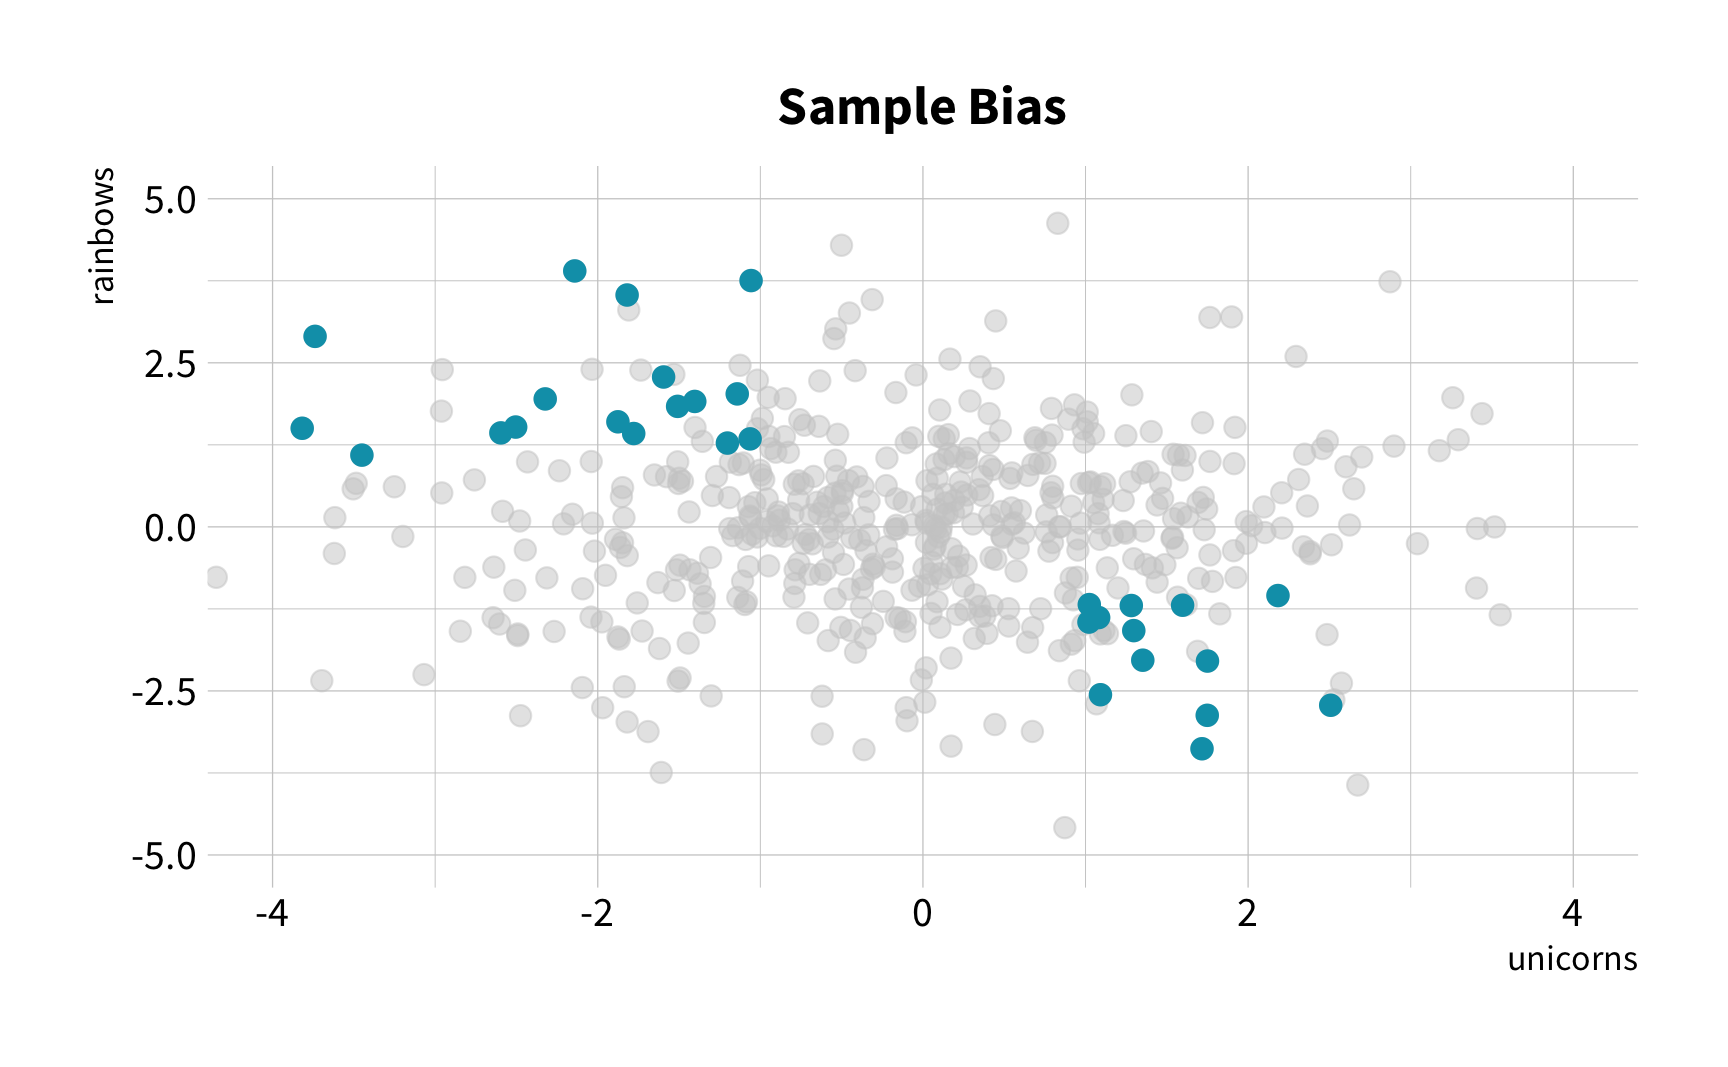
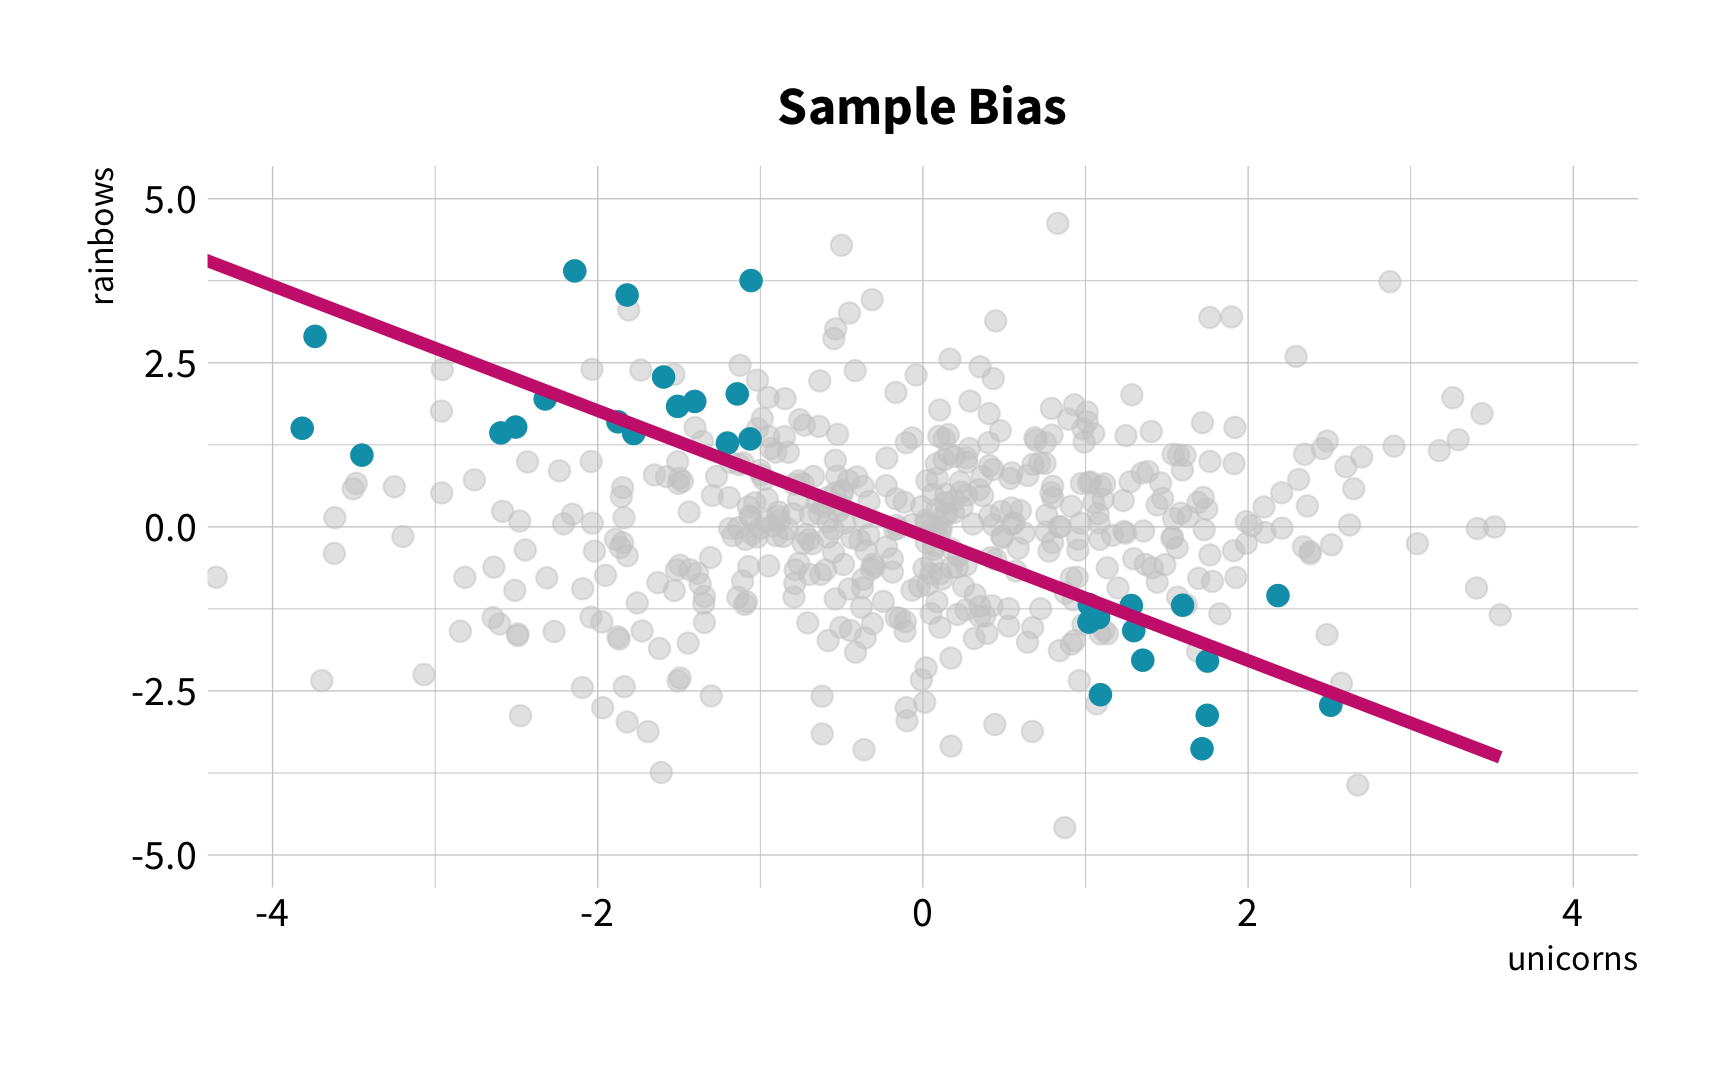
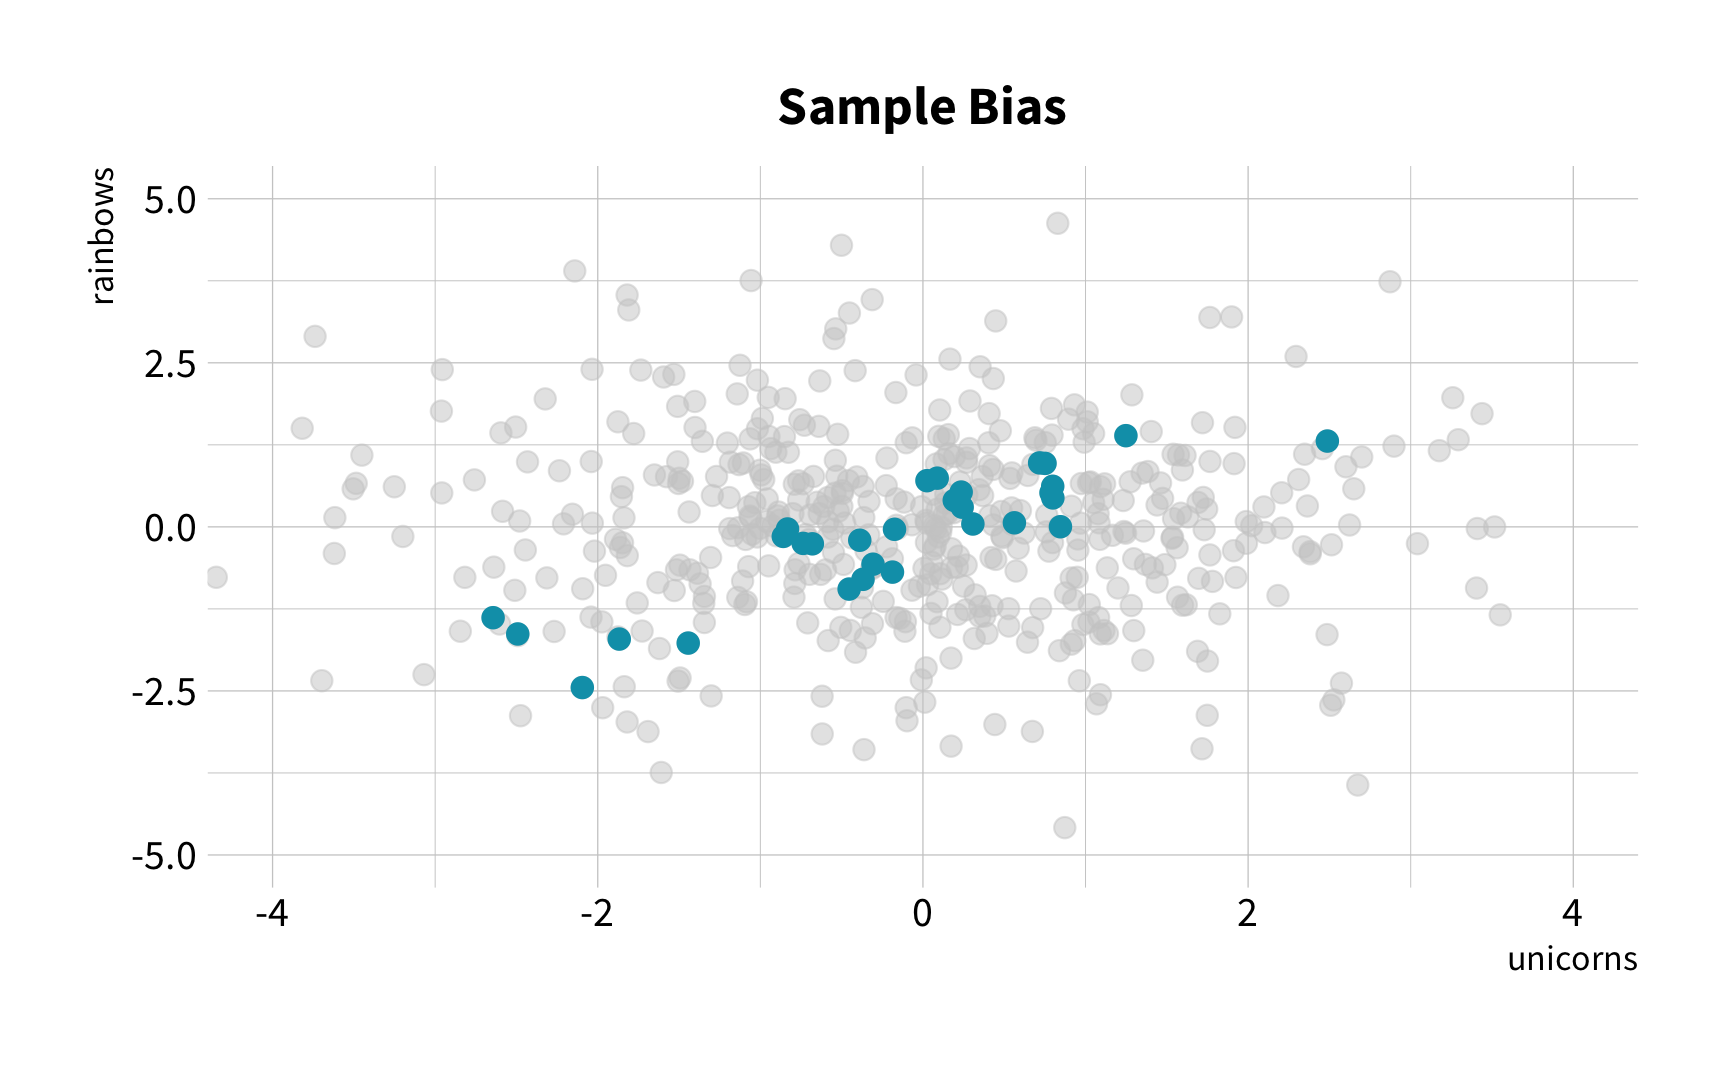
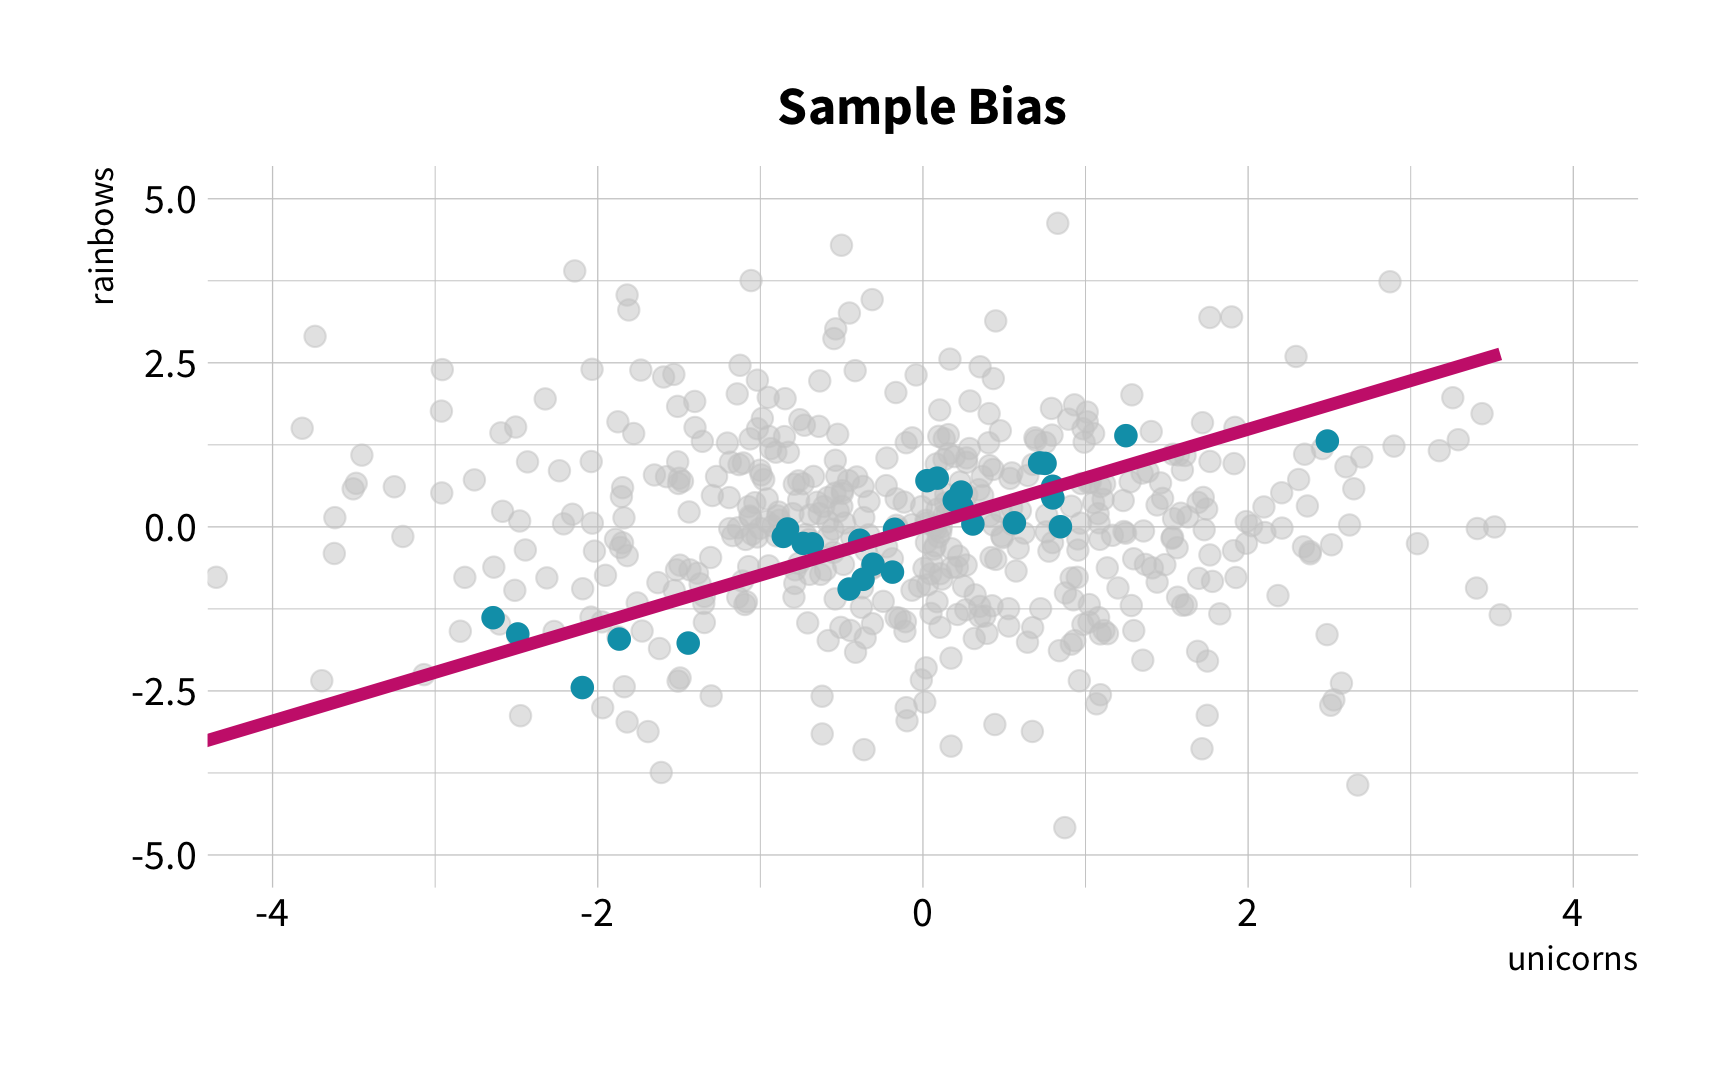
The Solution
Random Sampling
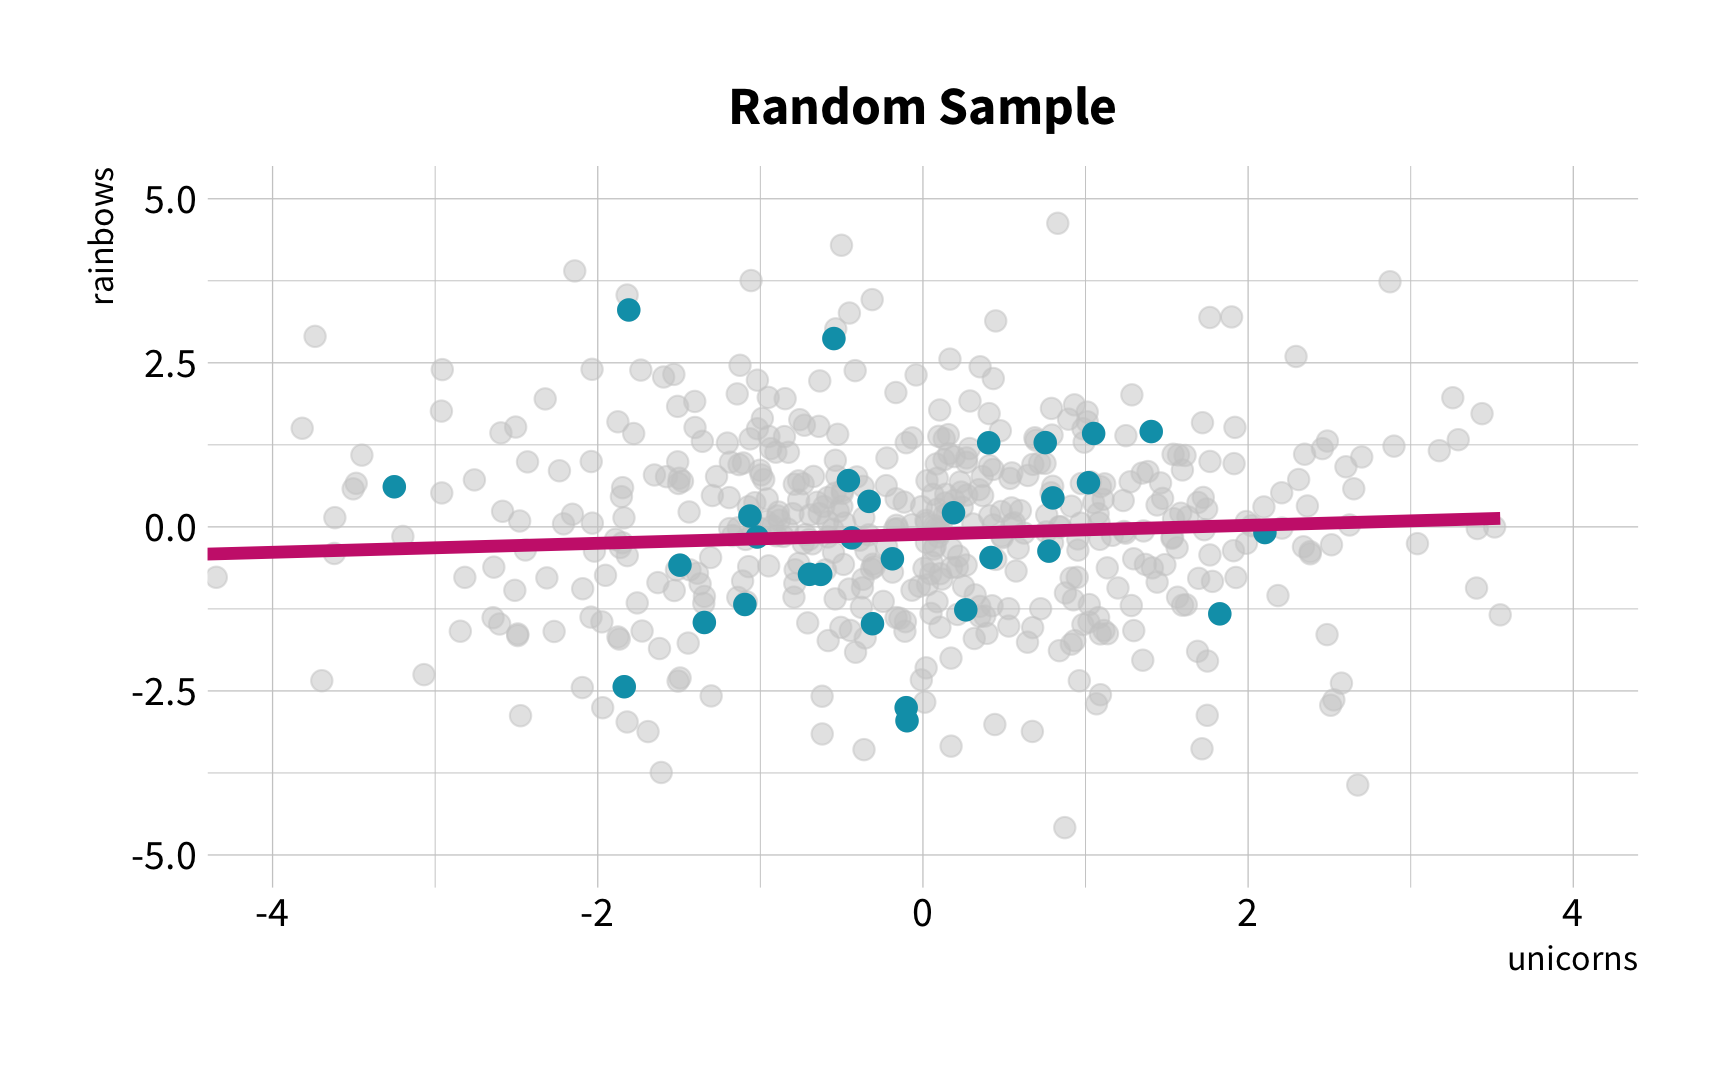
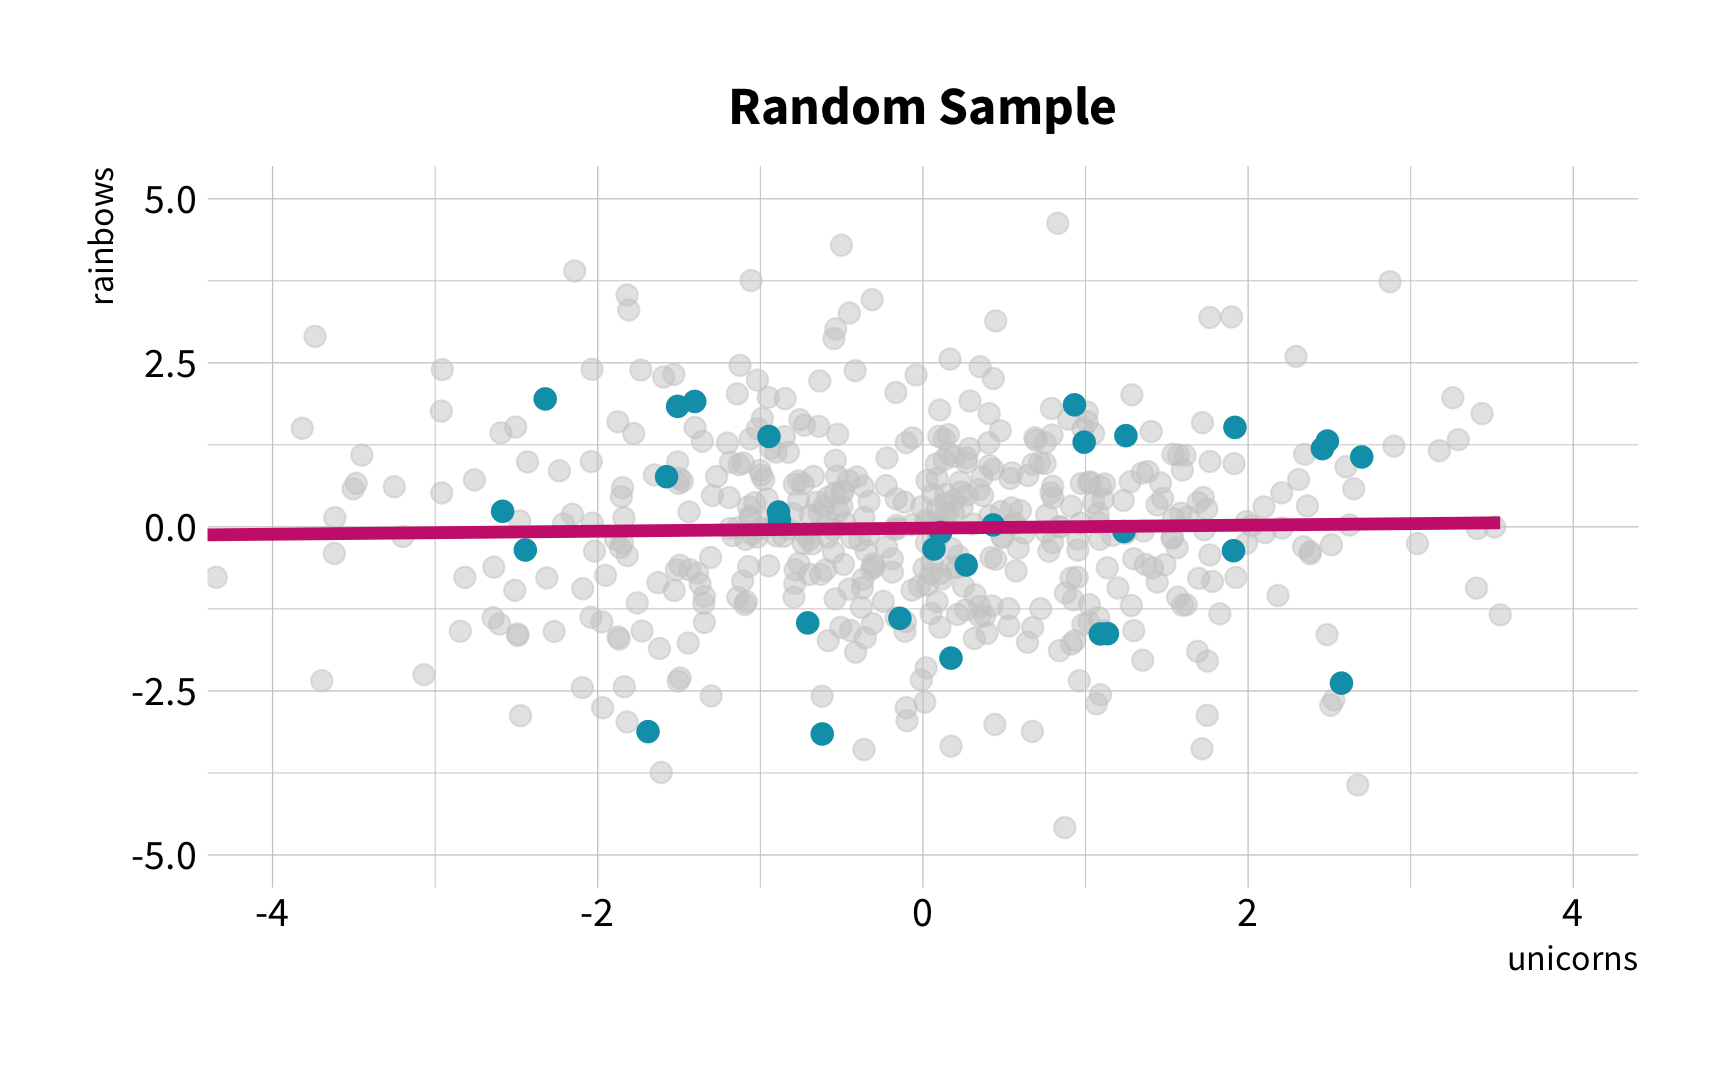
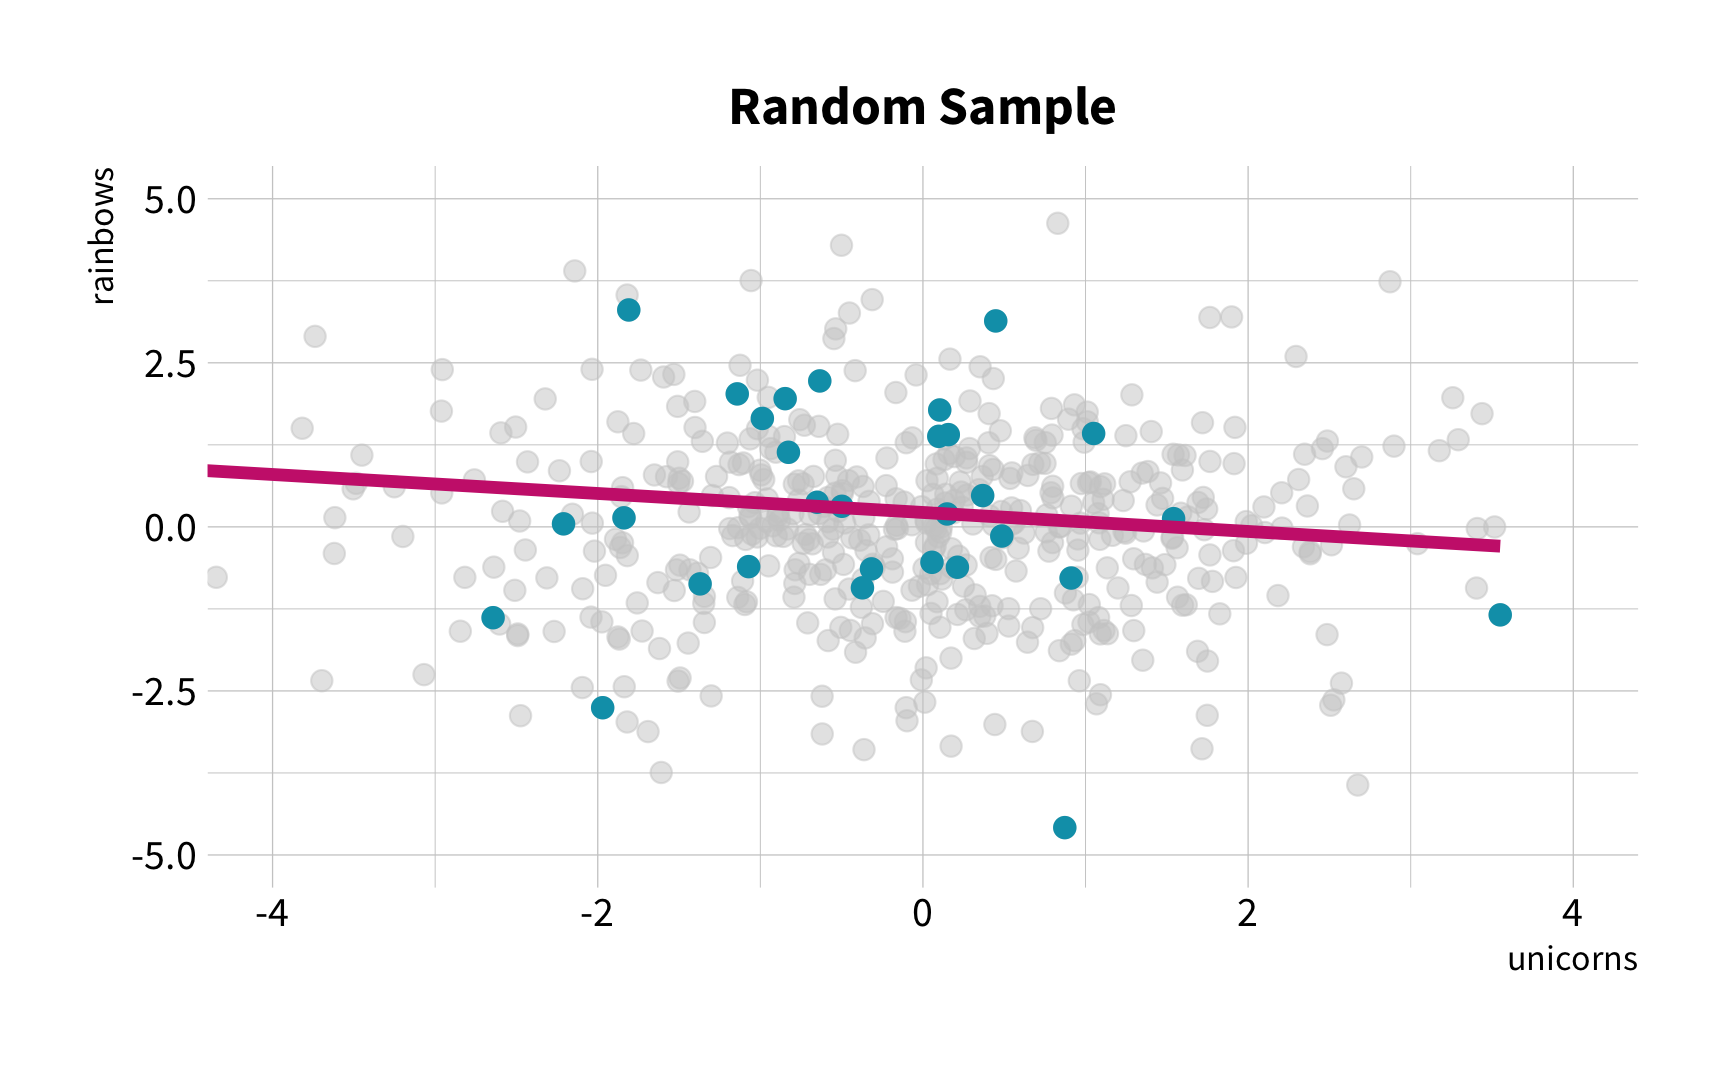
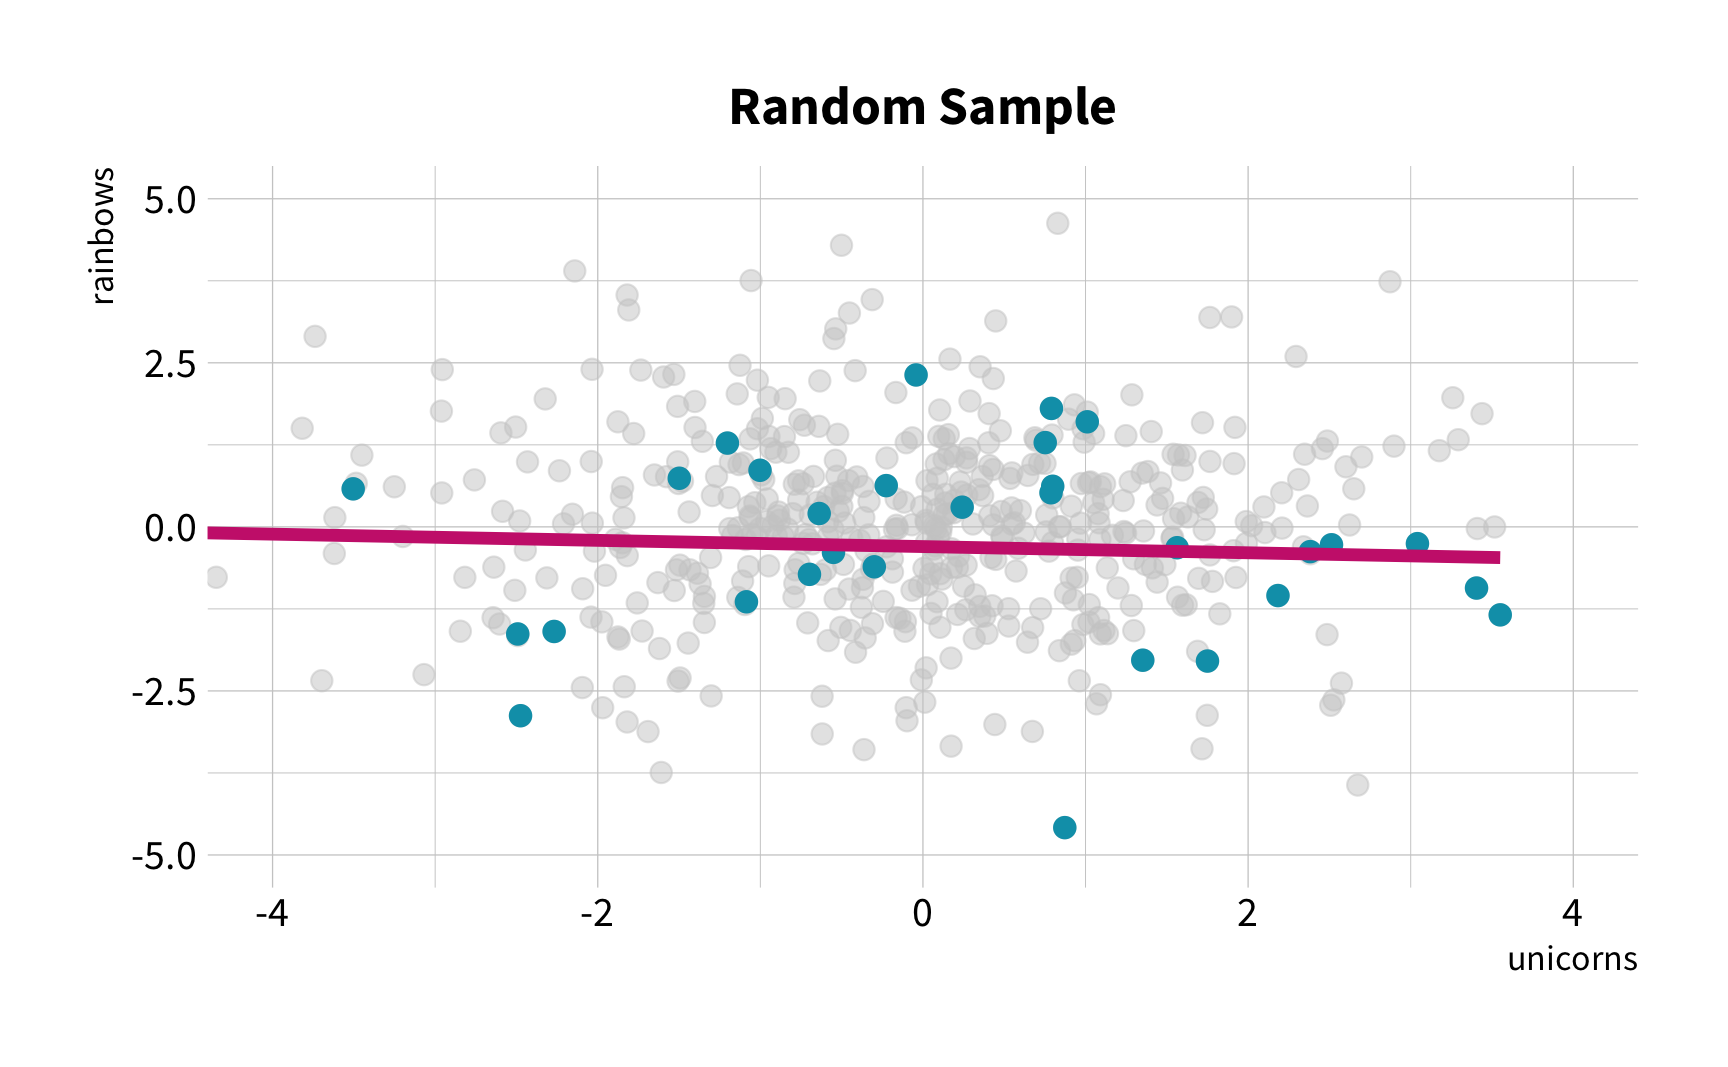
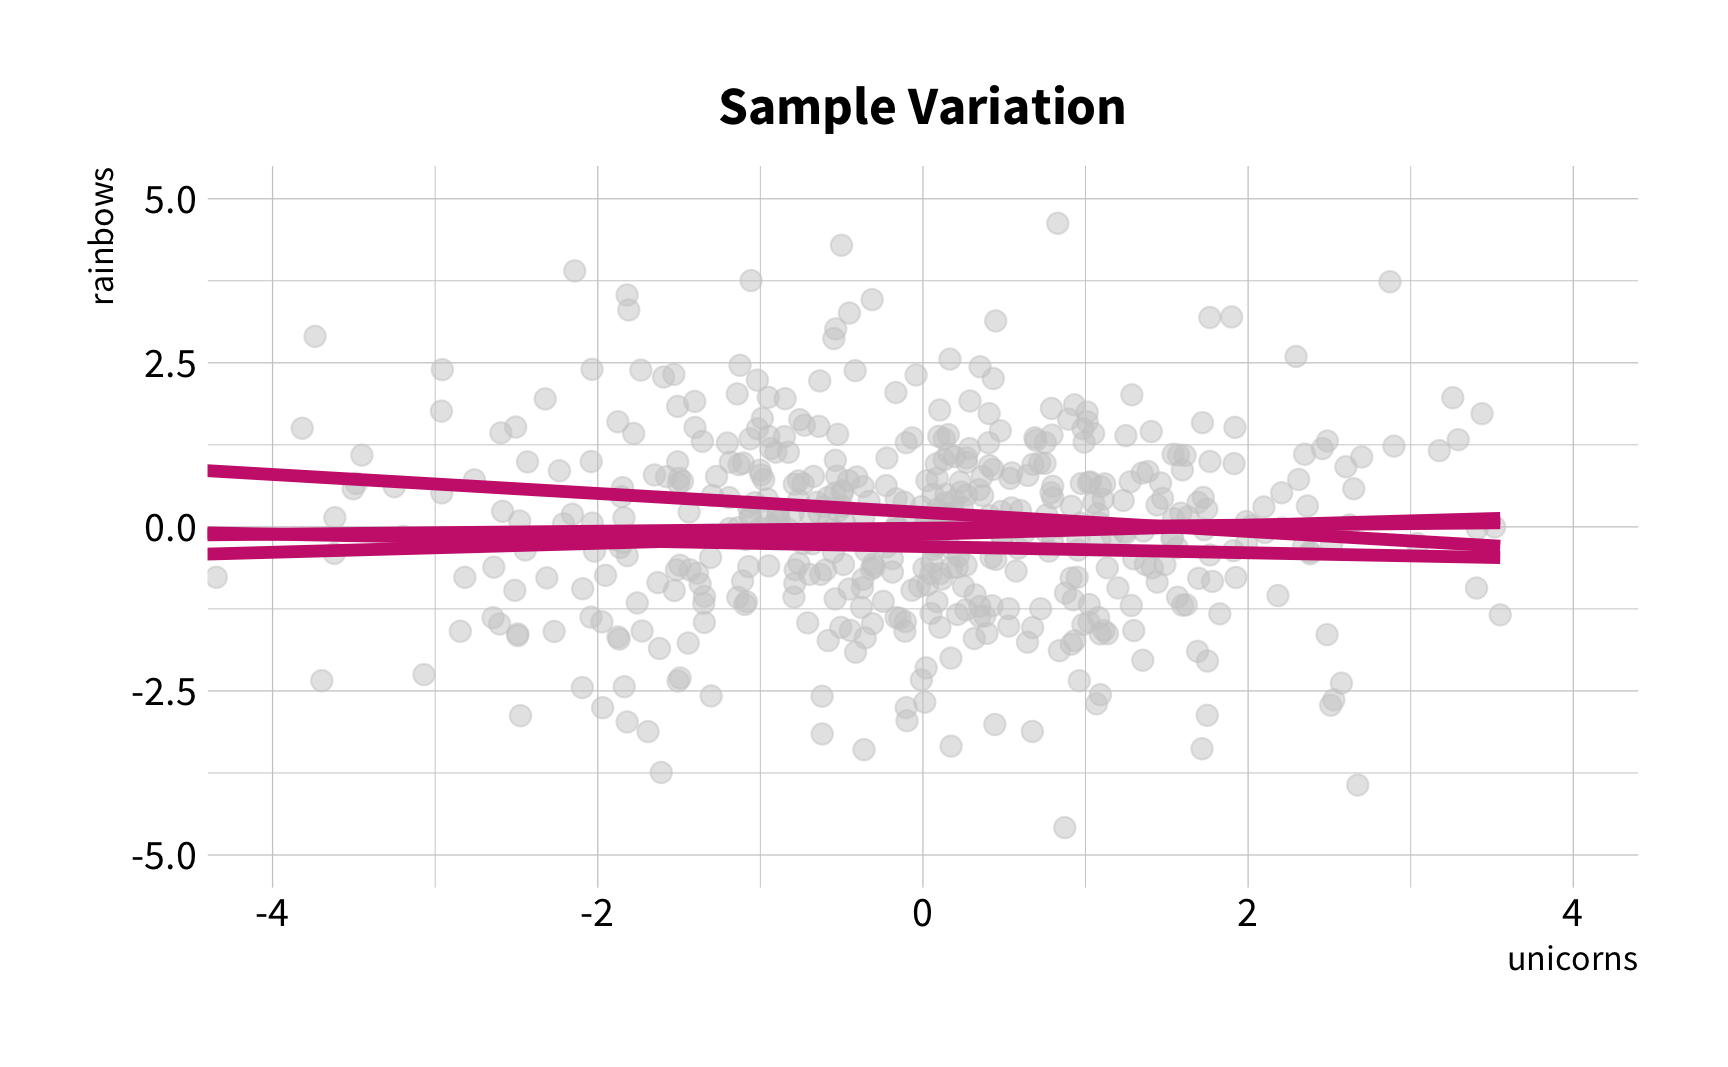
The New Challenge
Sample Variation
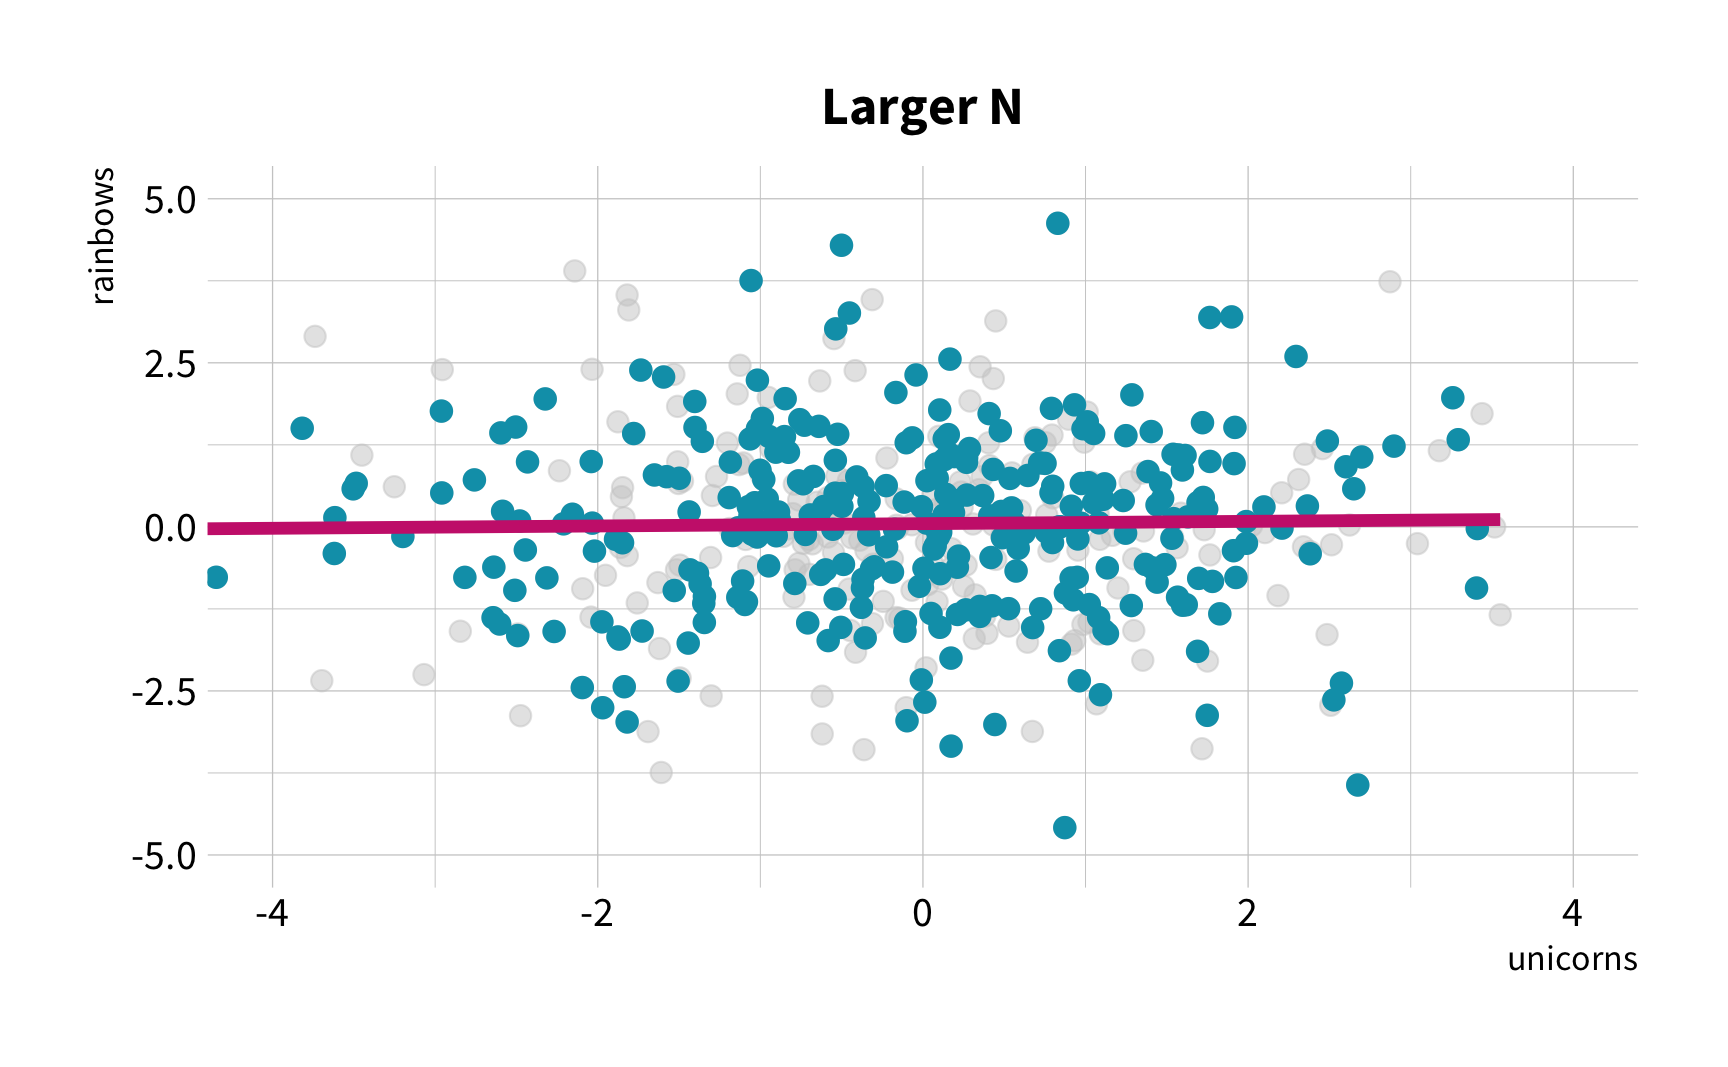
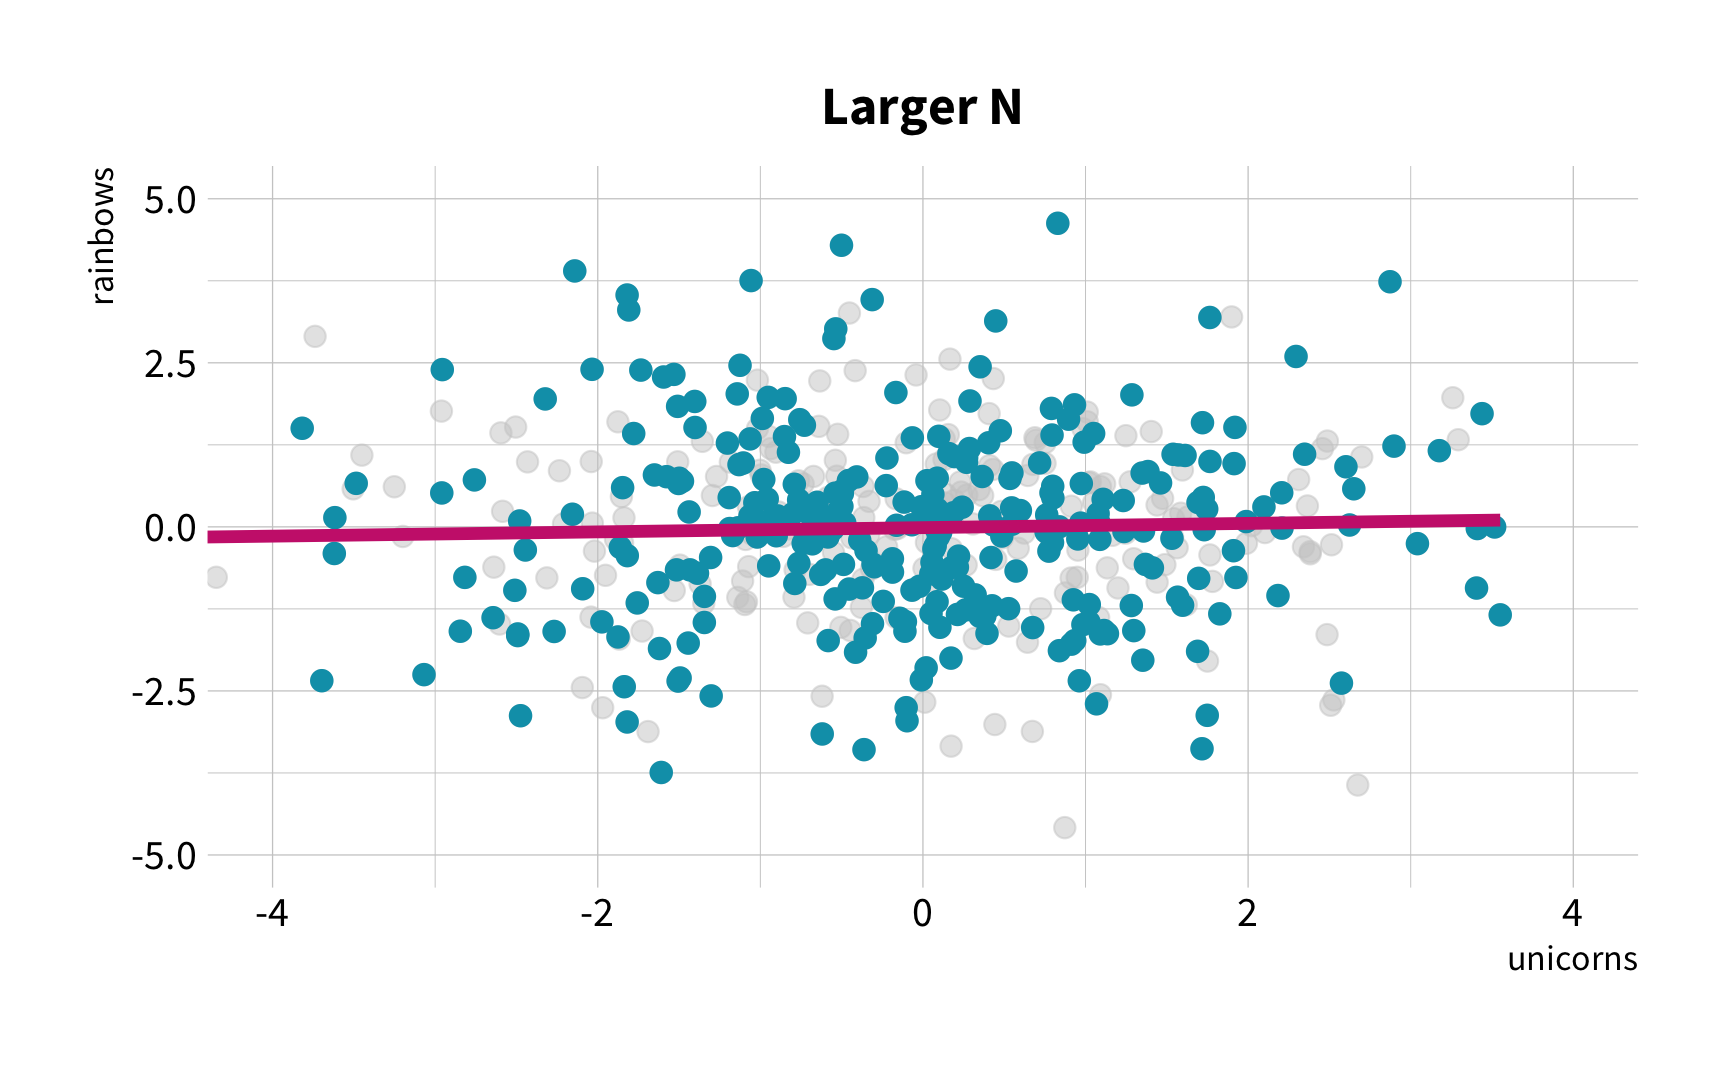
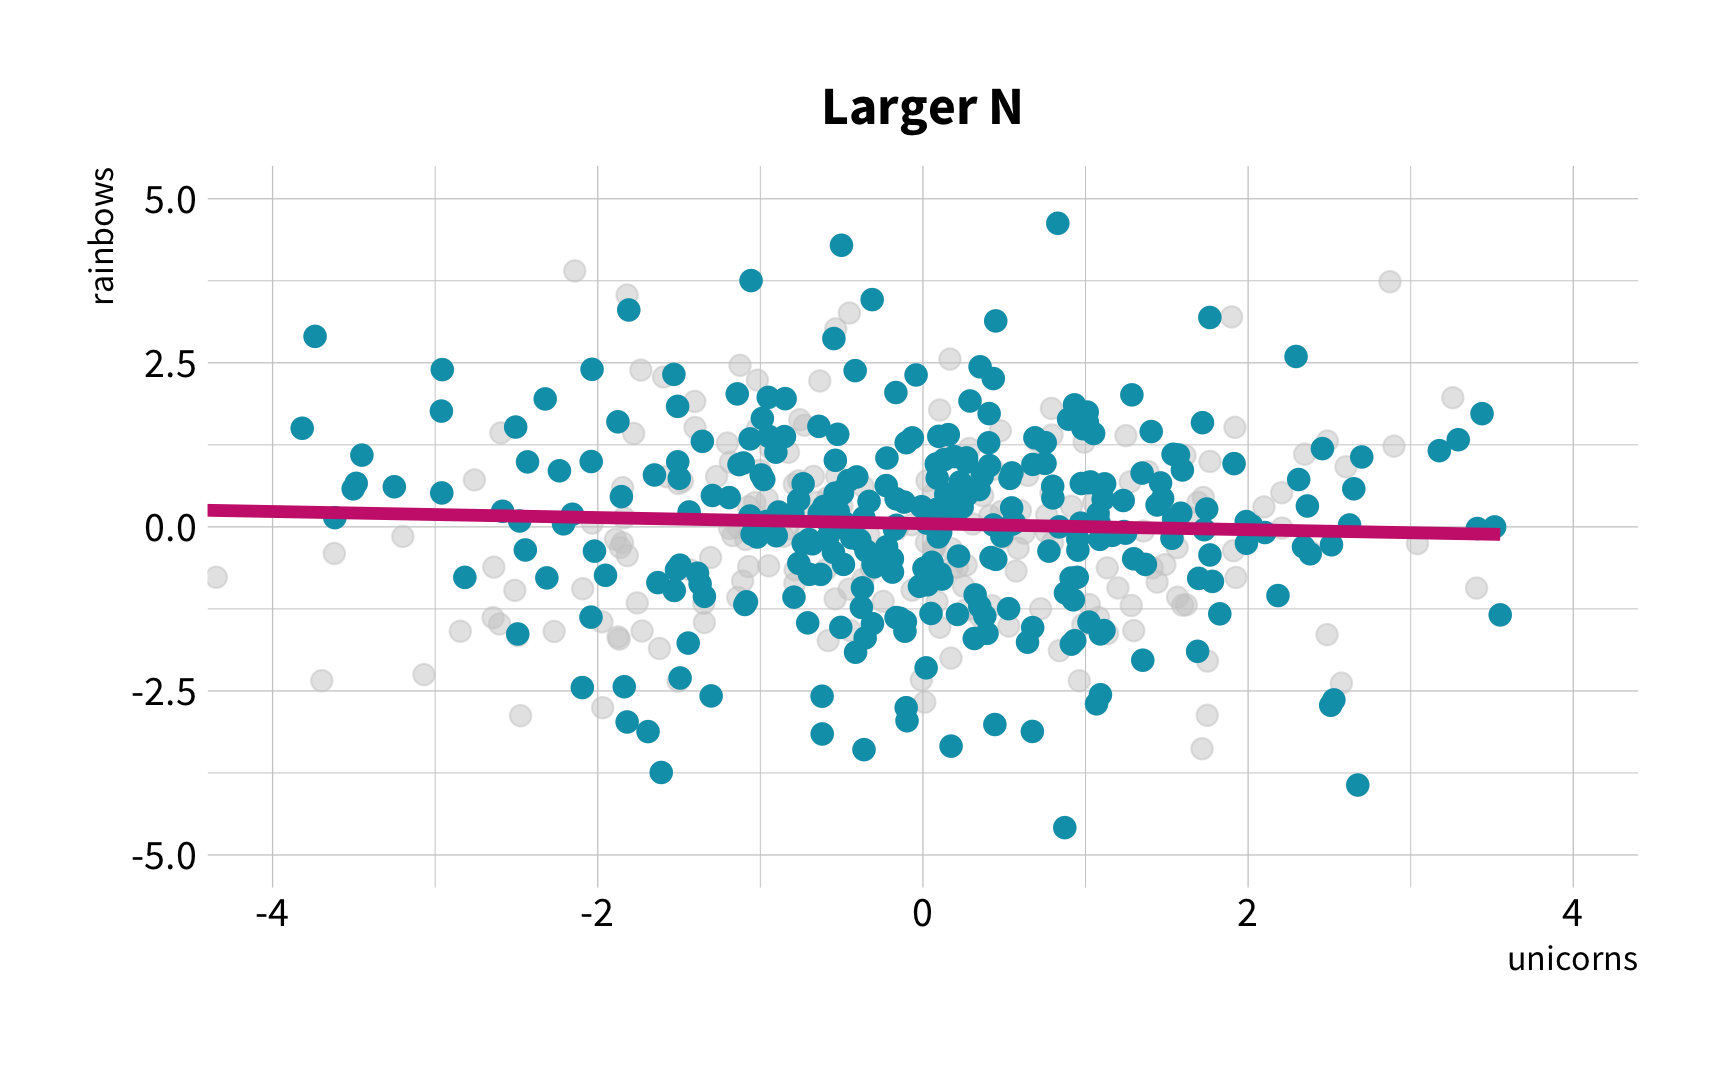
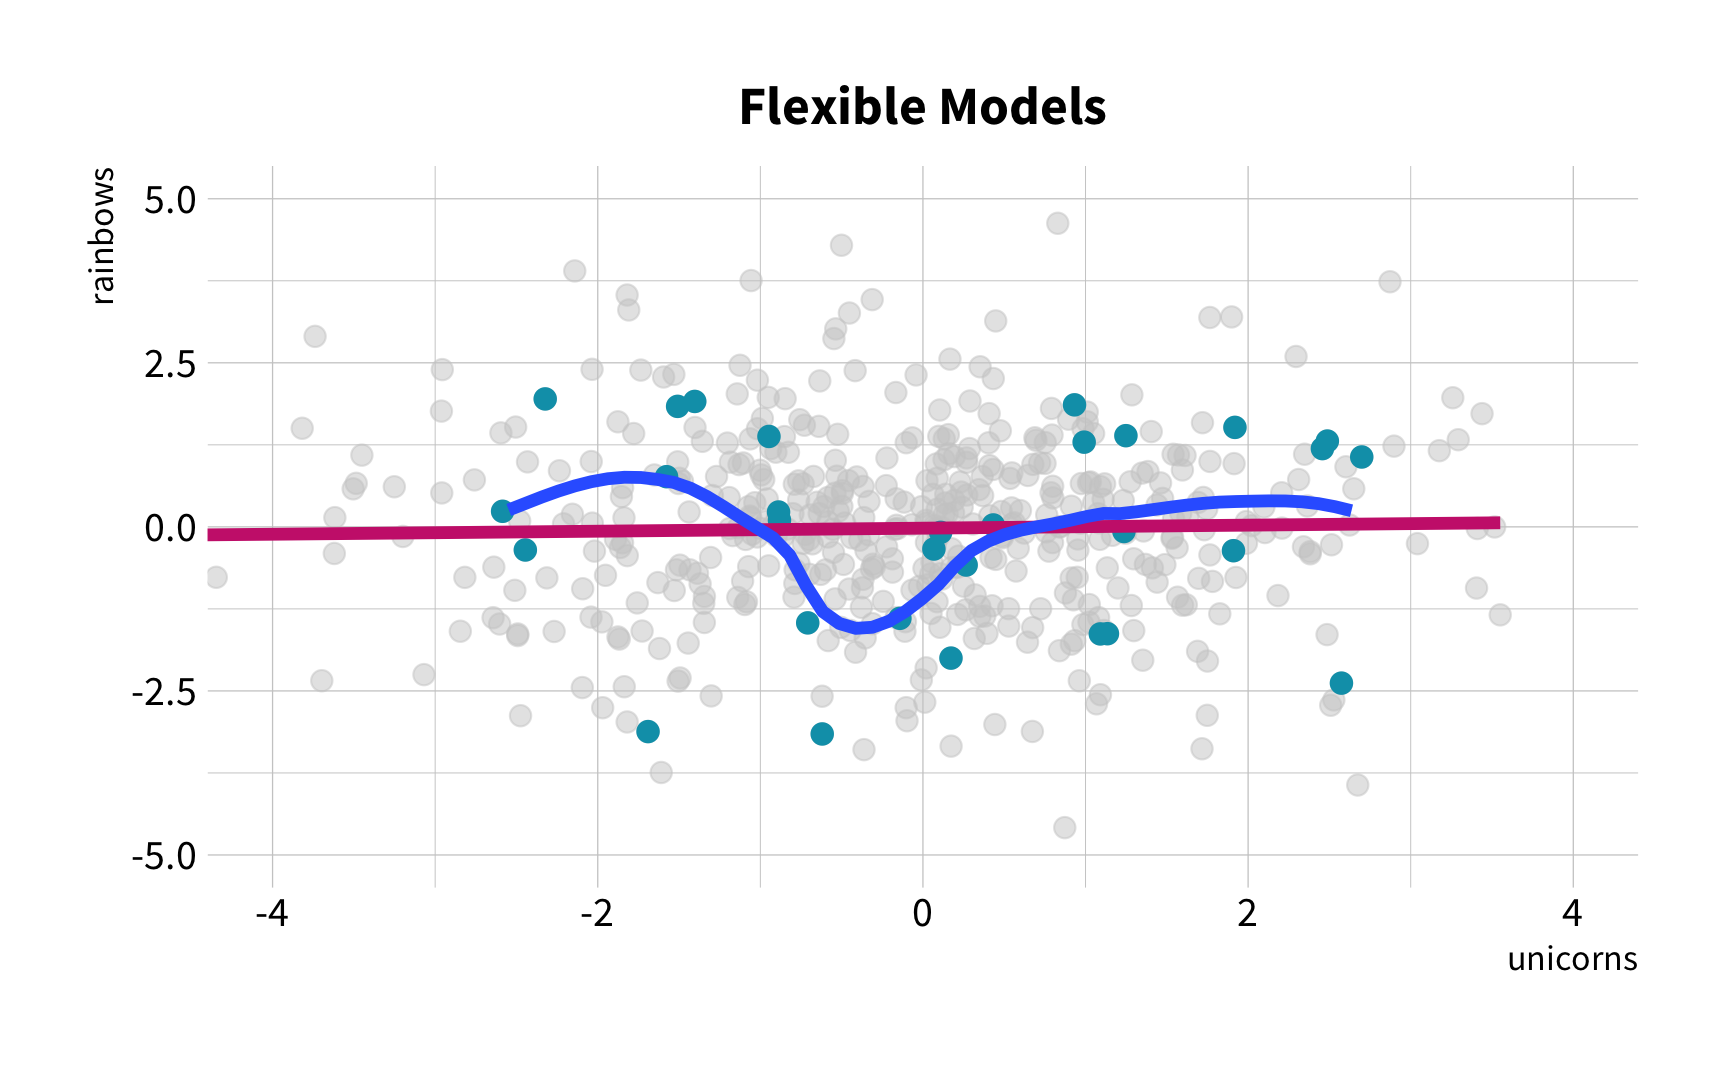
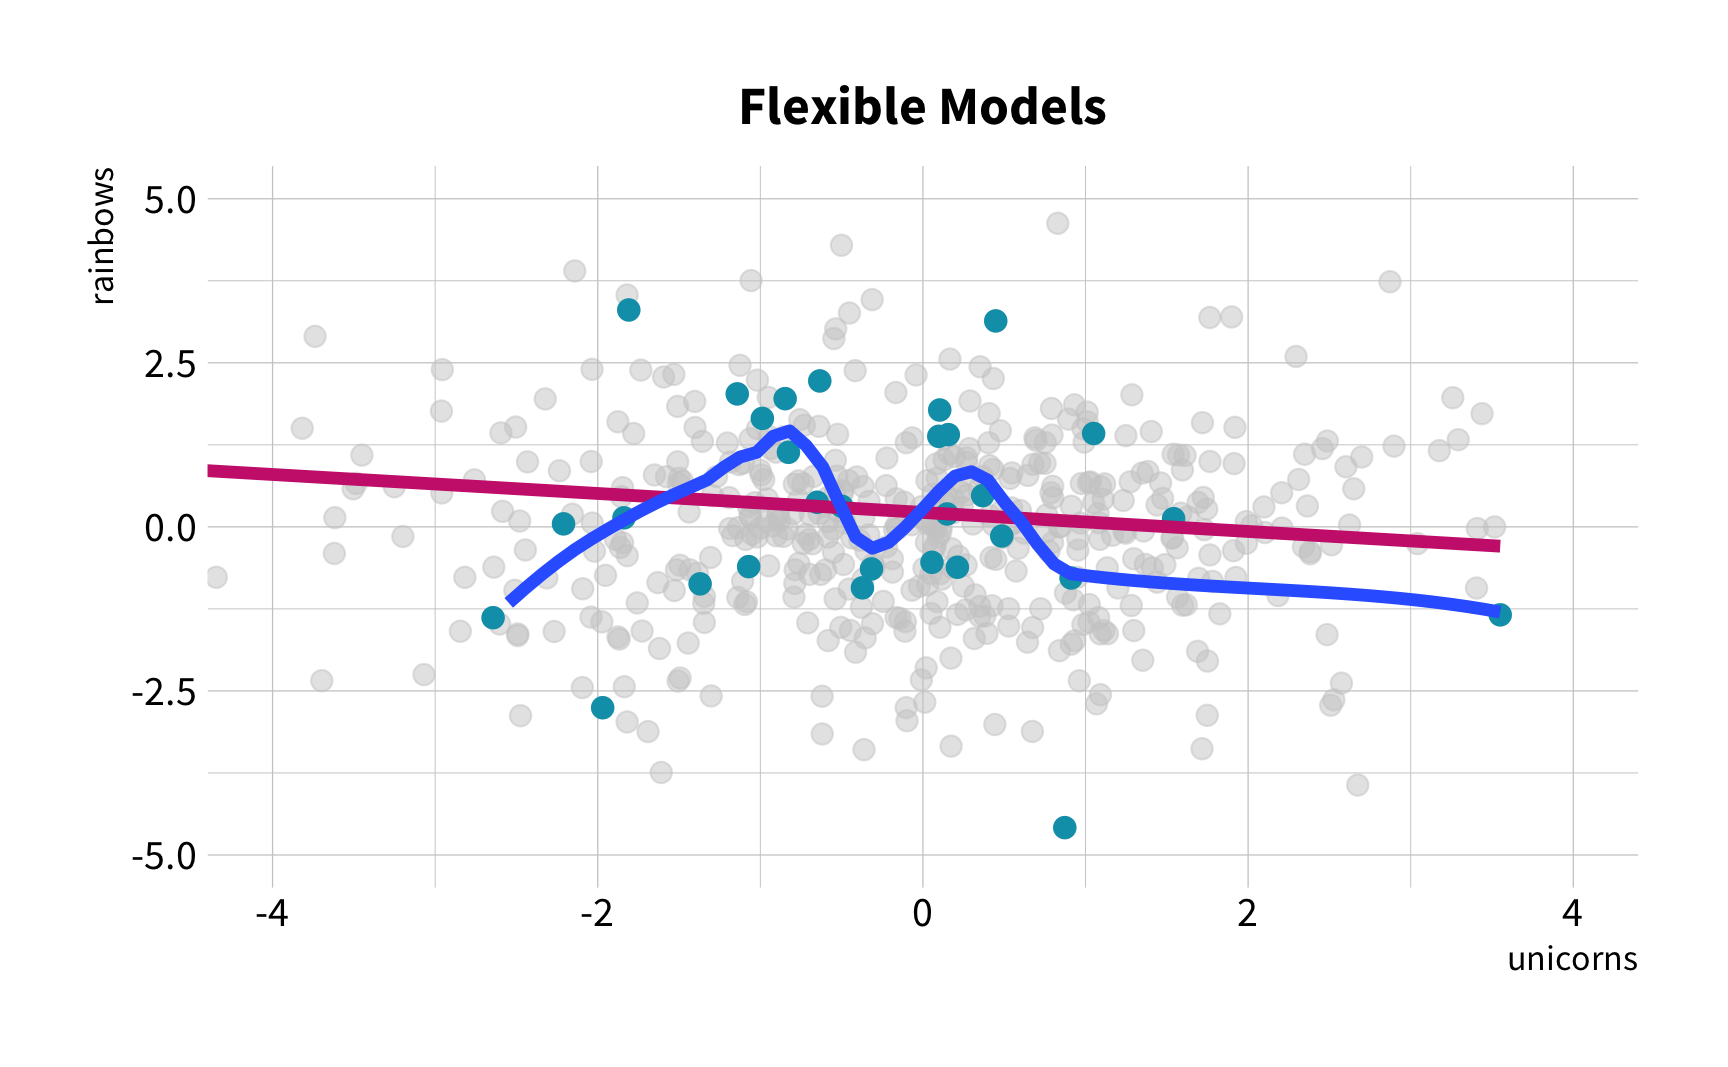
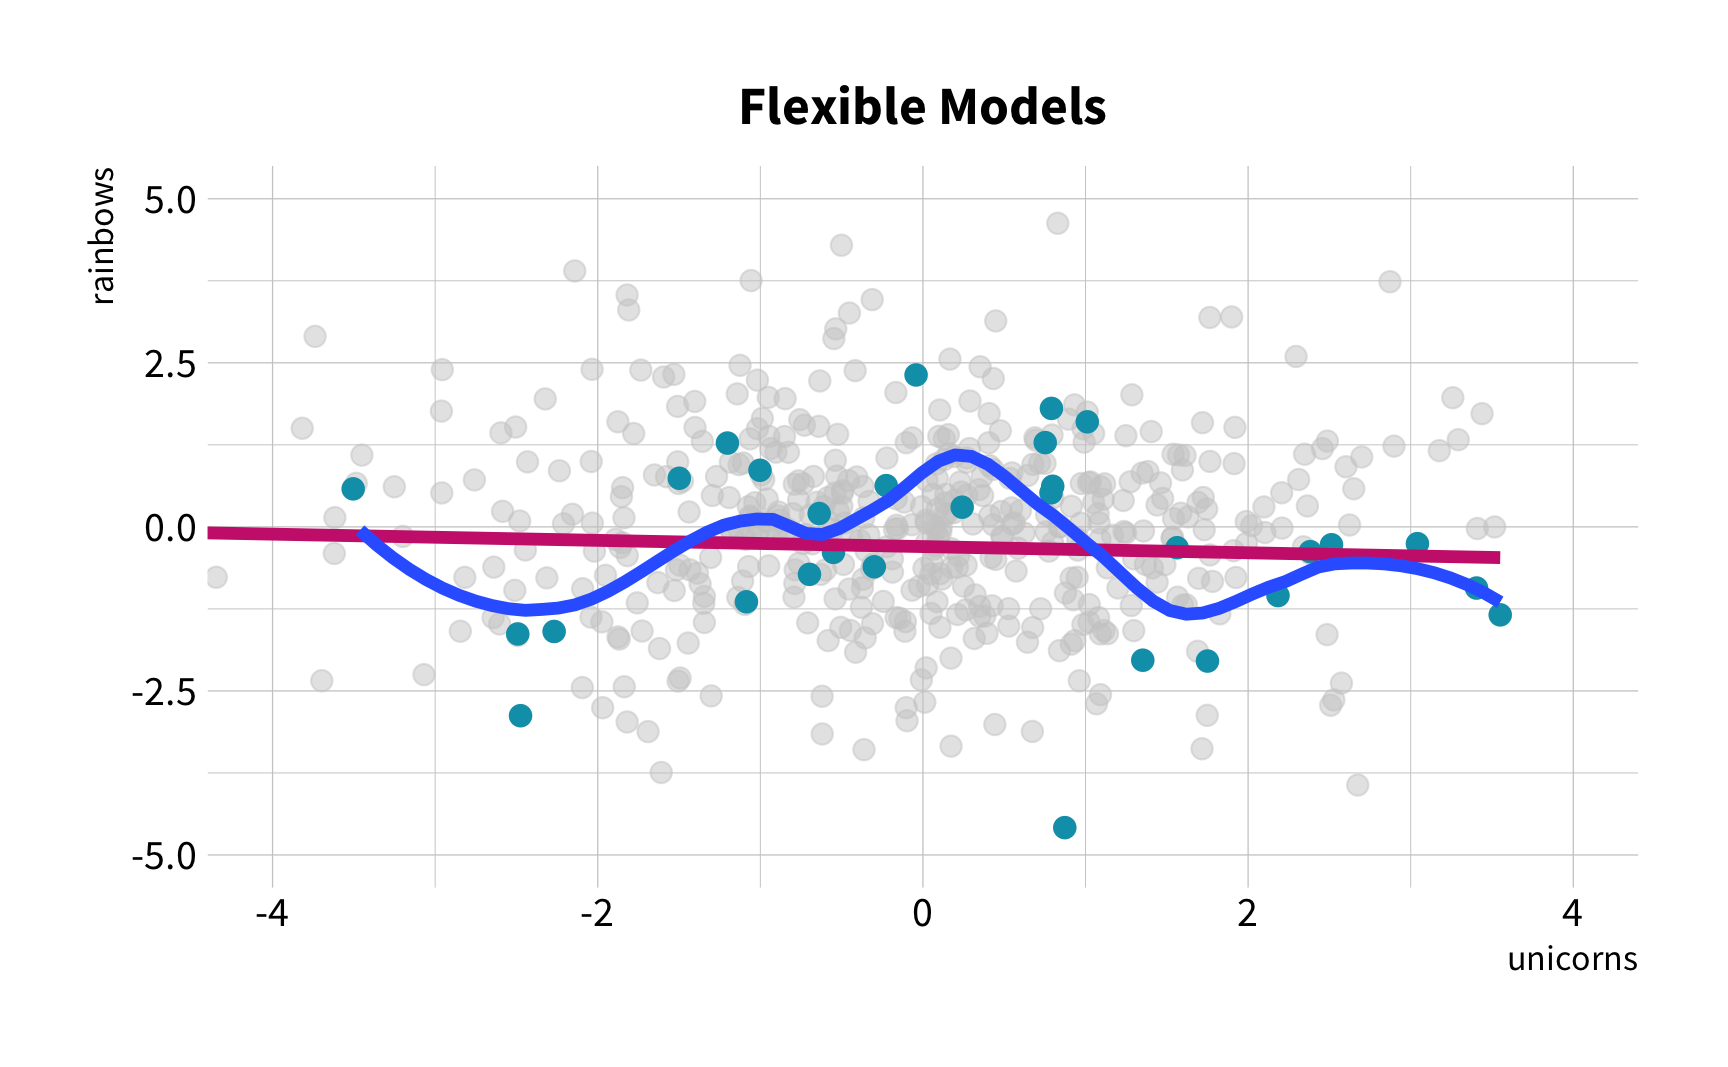
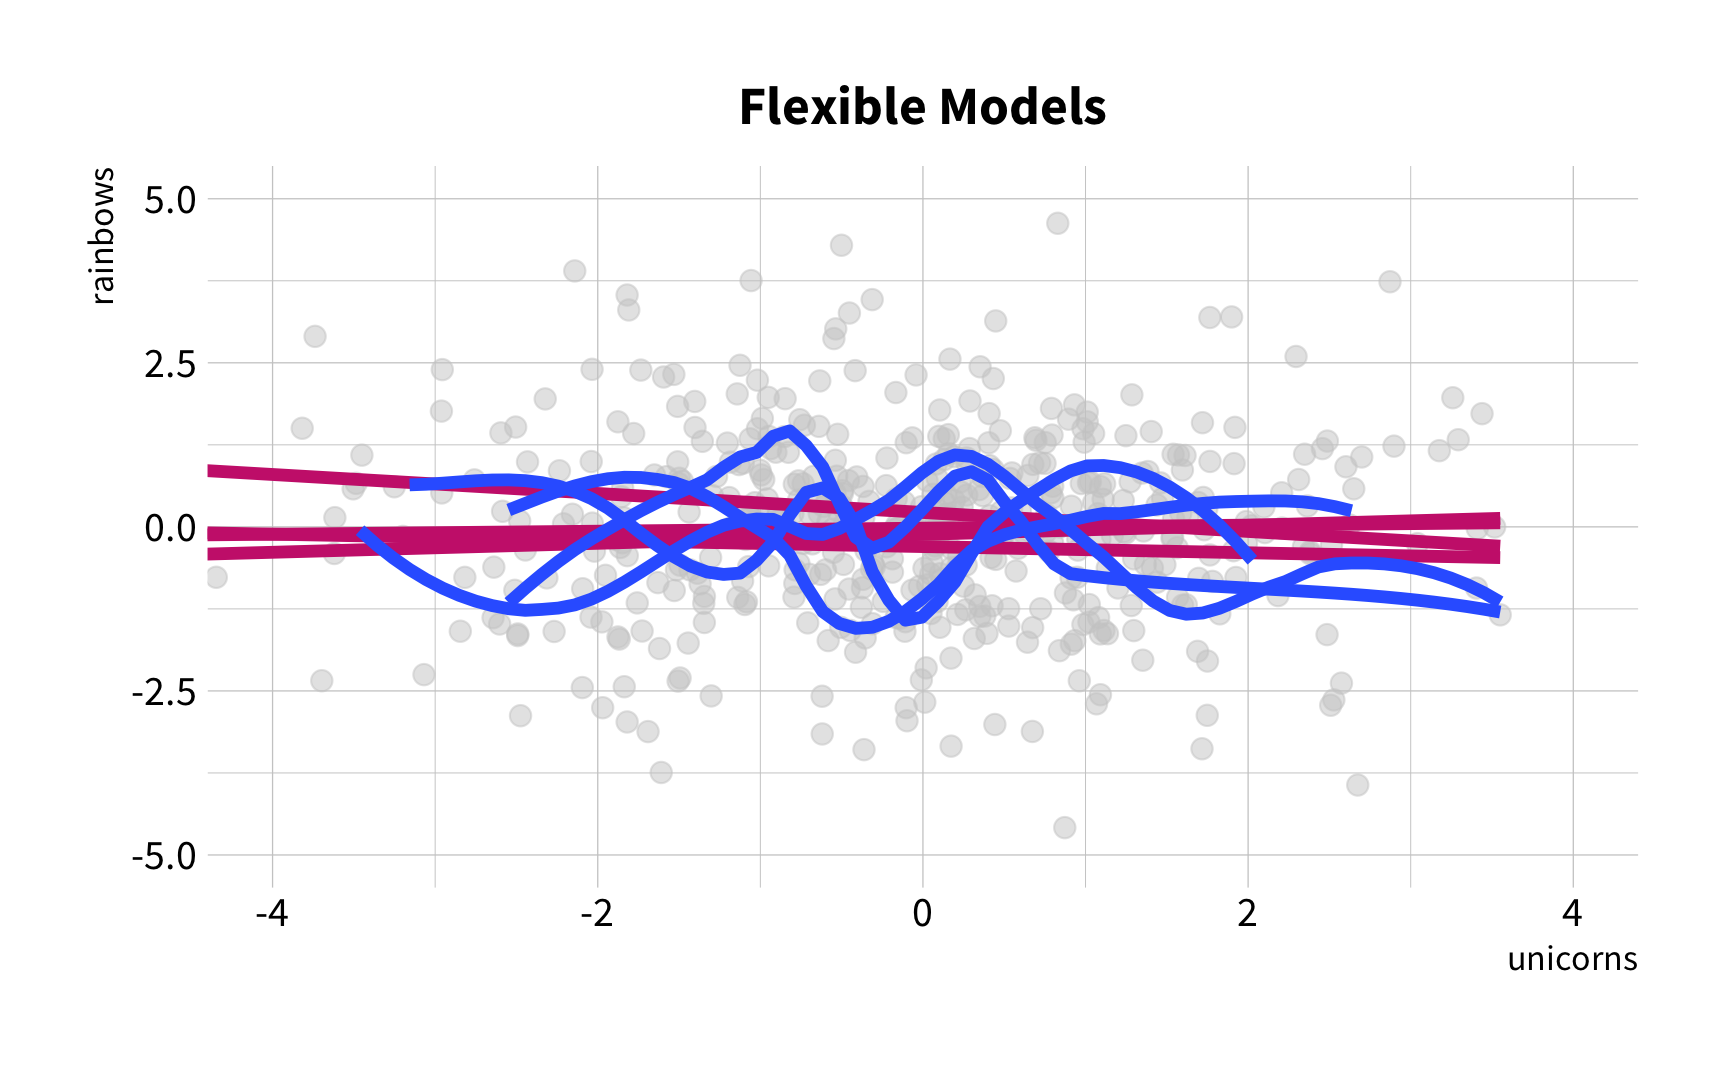
The good news
You don't have to collect more data.
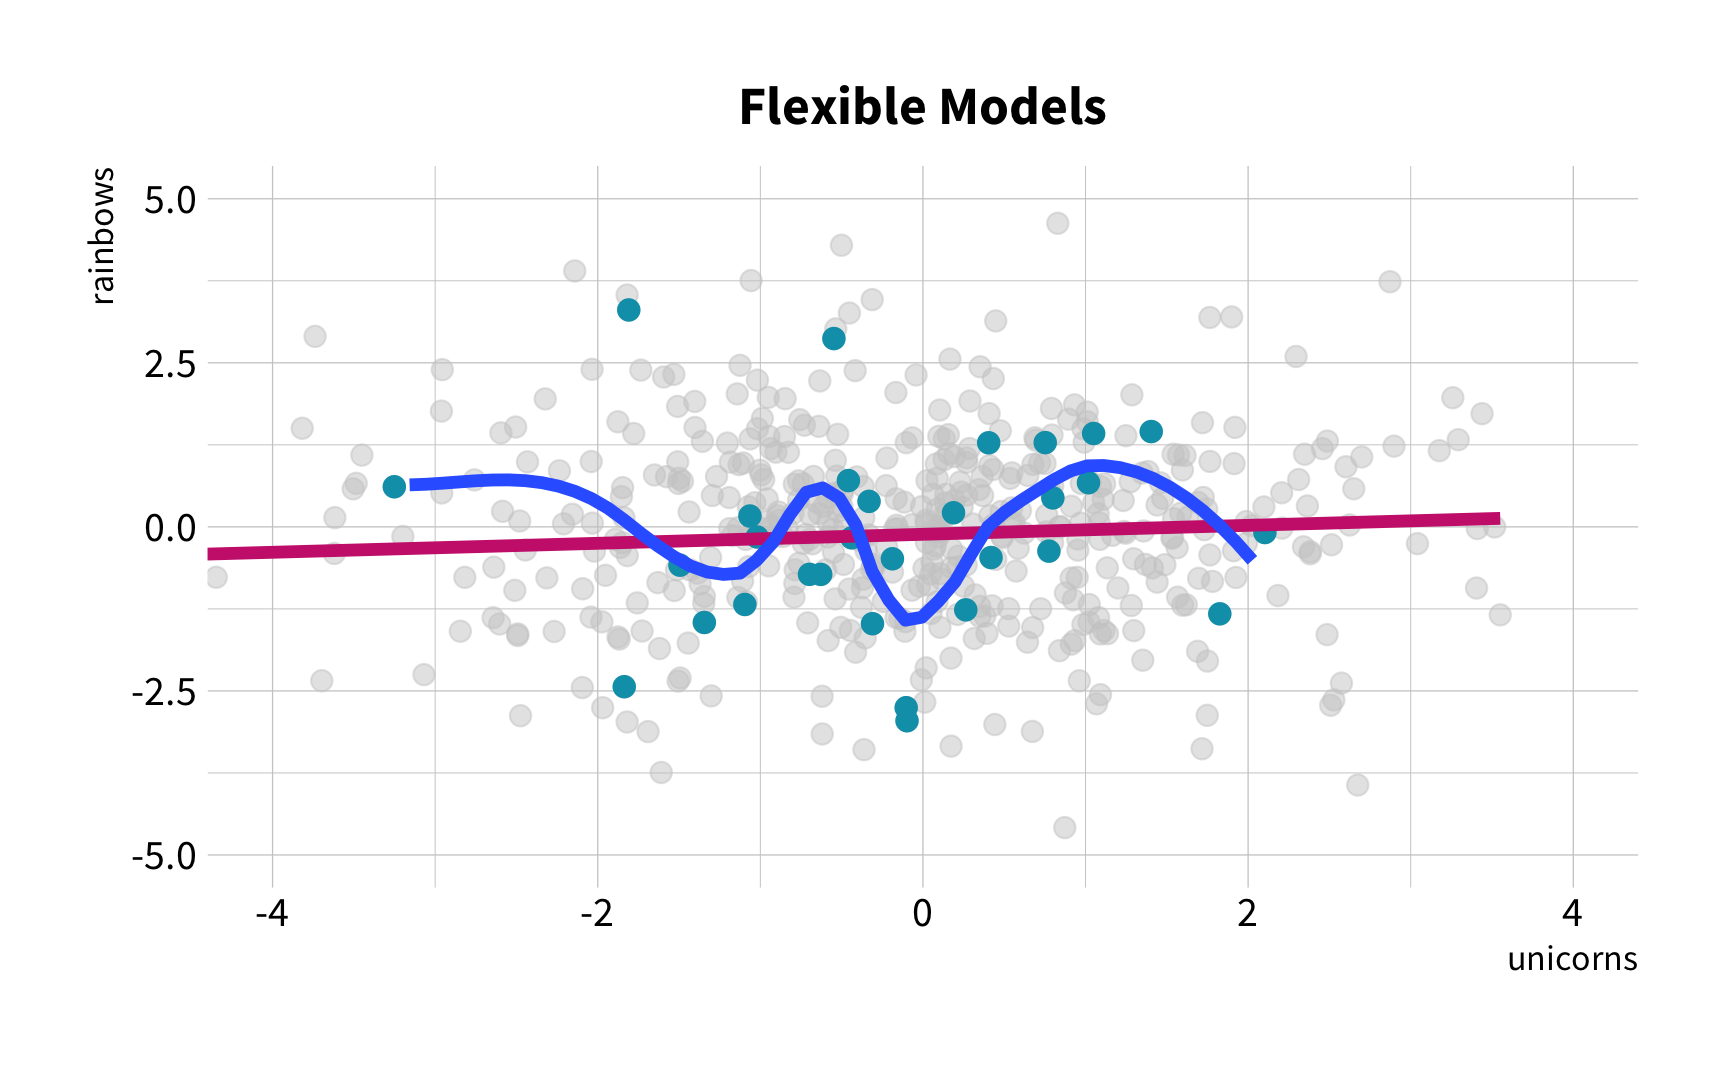
You don't have to sacrifice fit for flexibility.
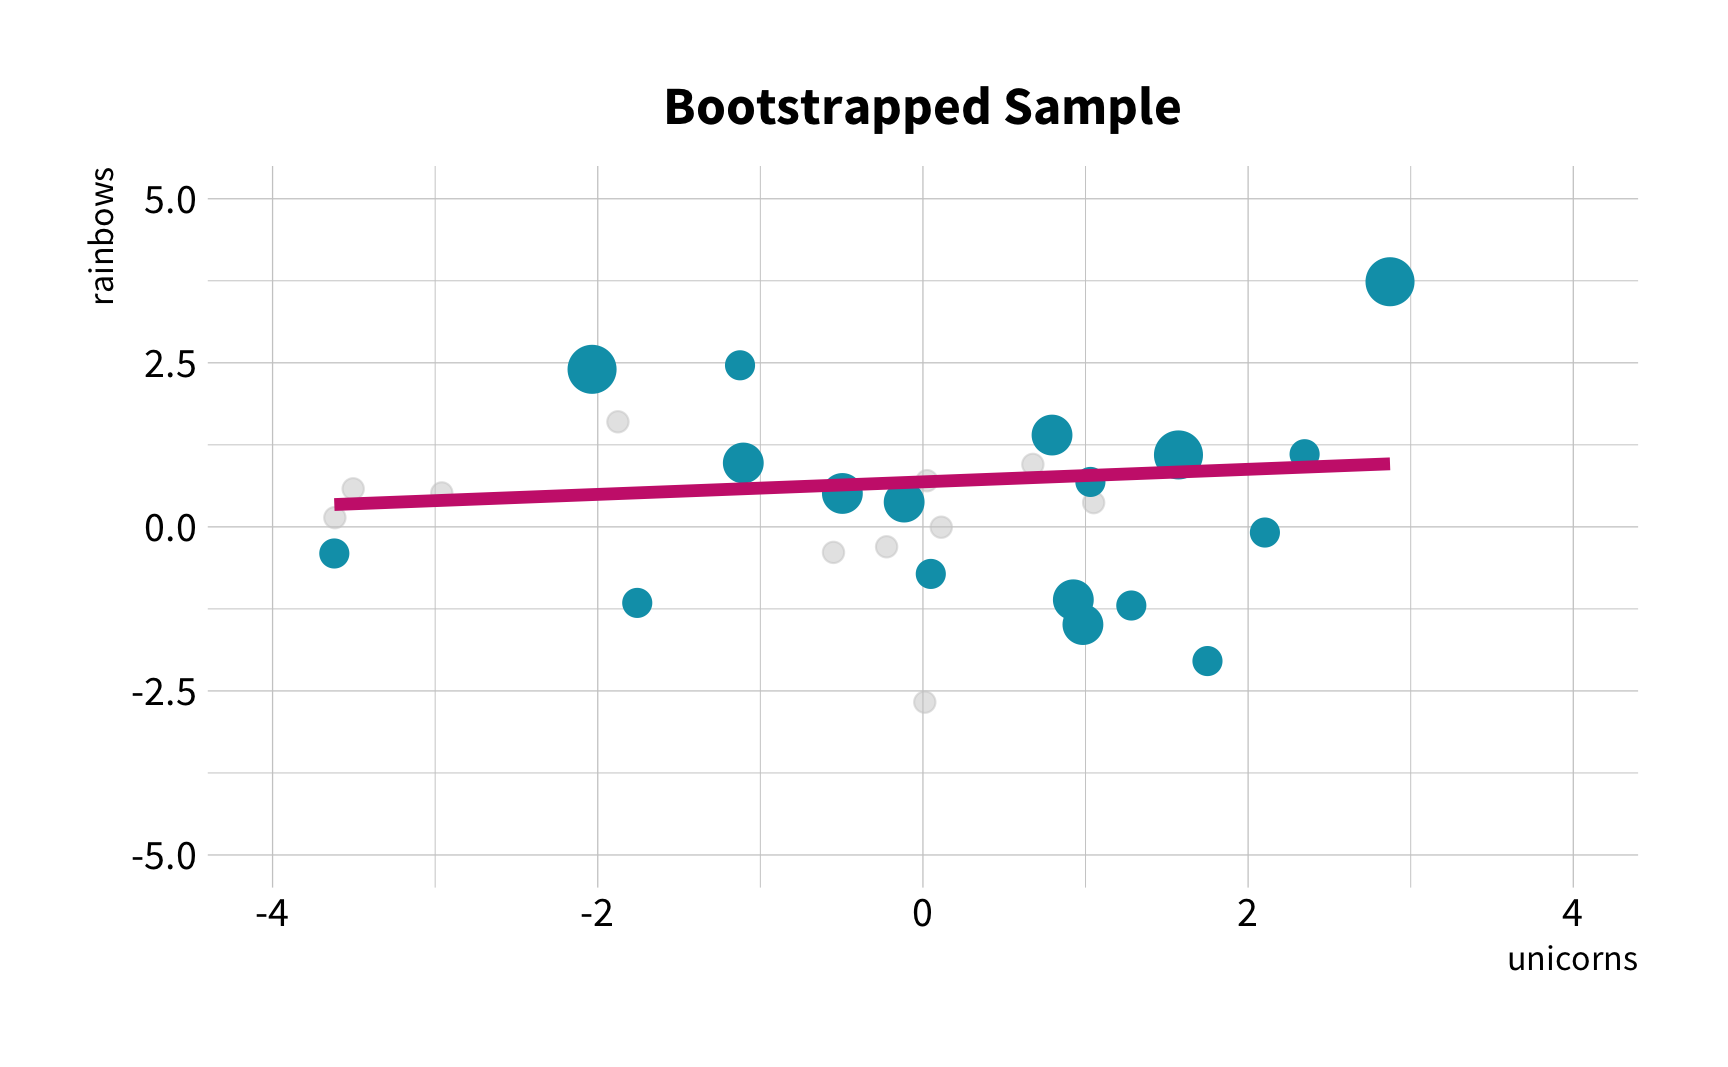
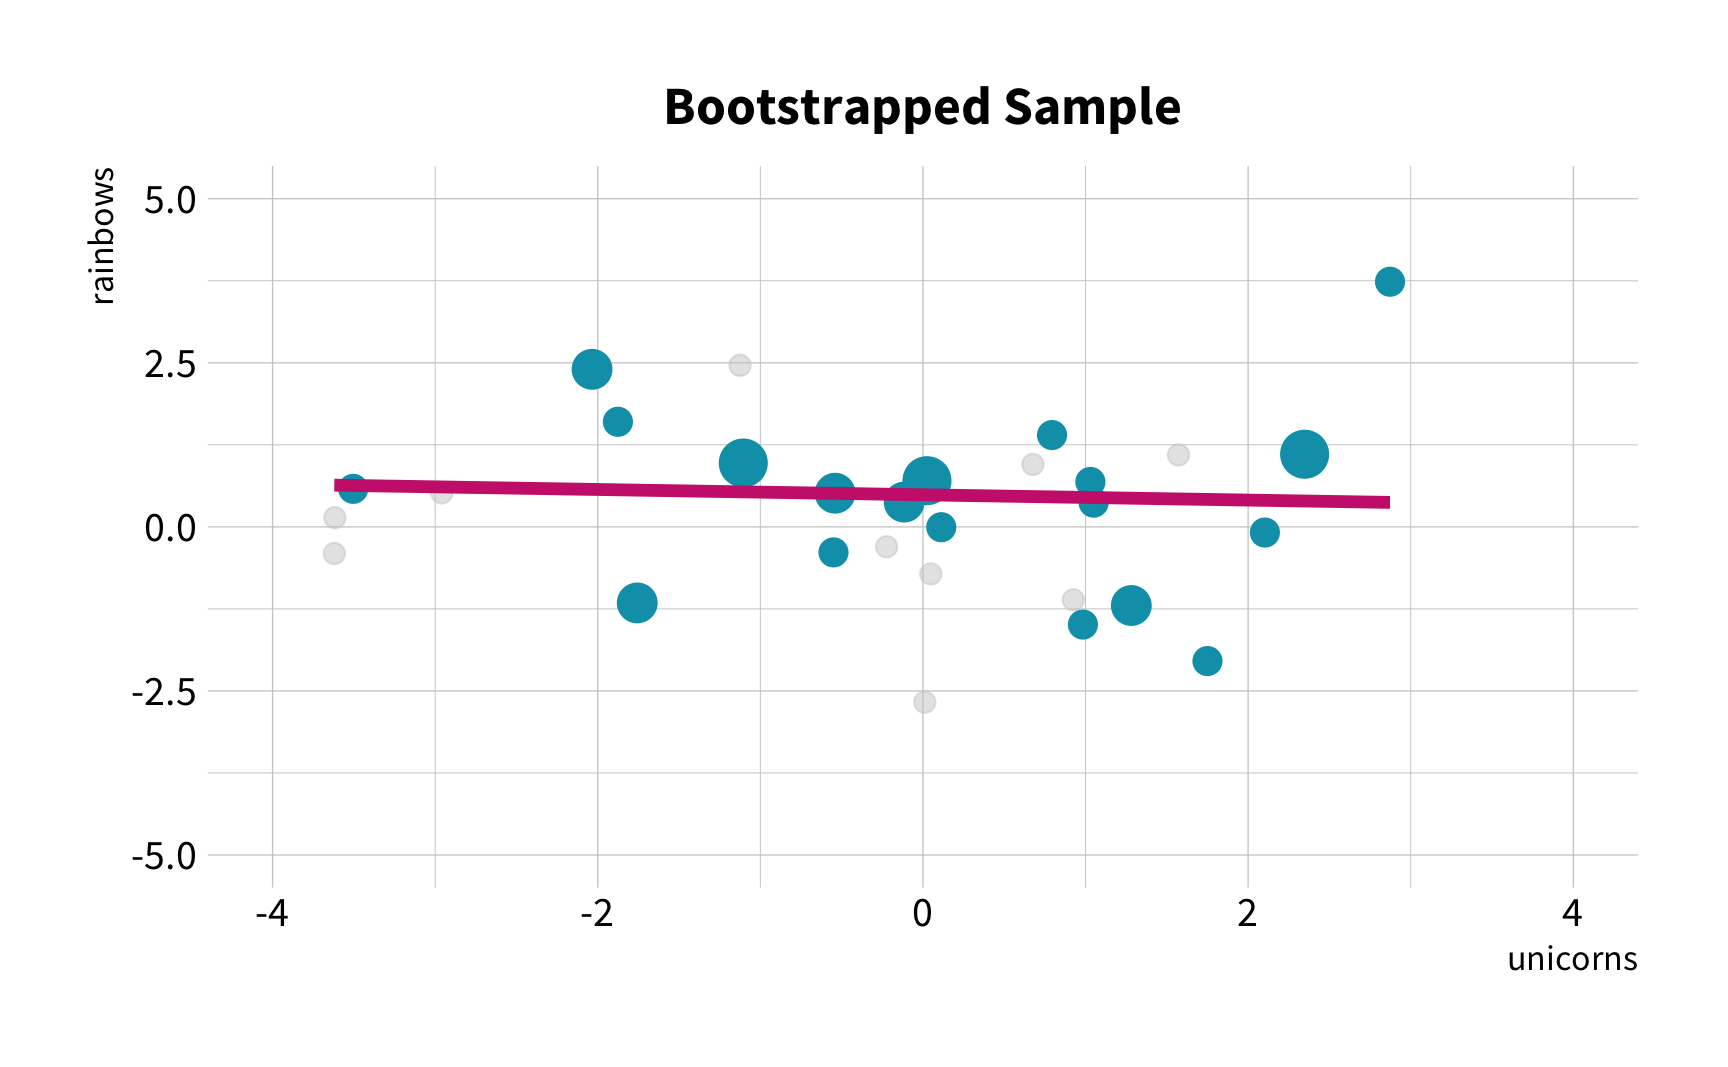
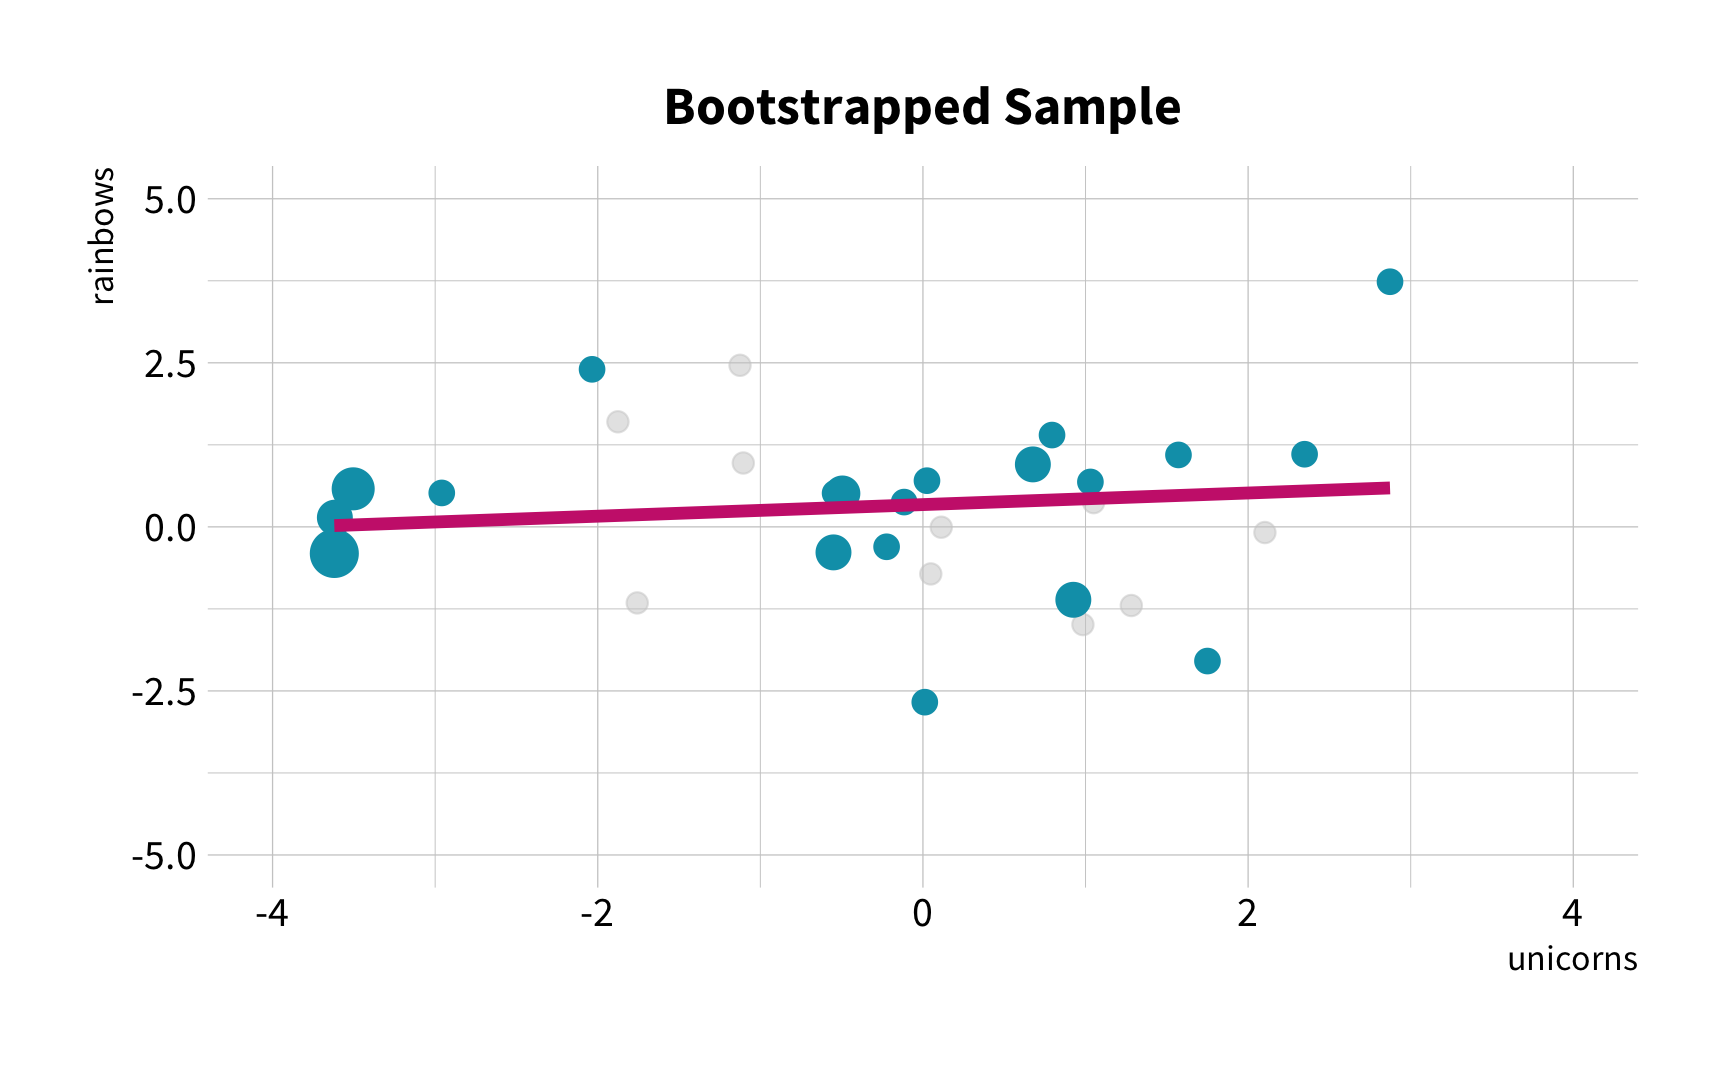
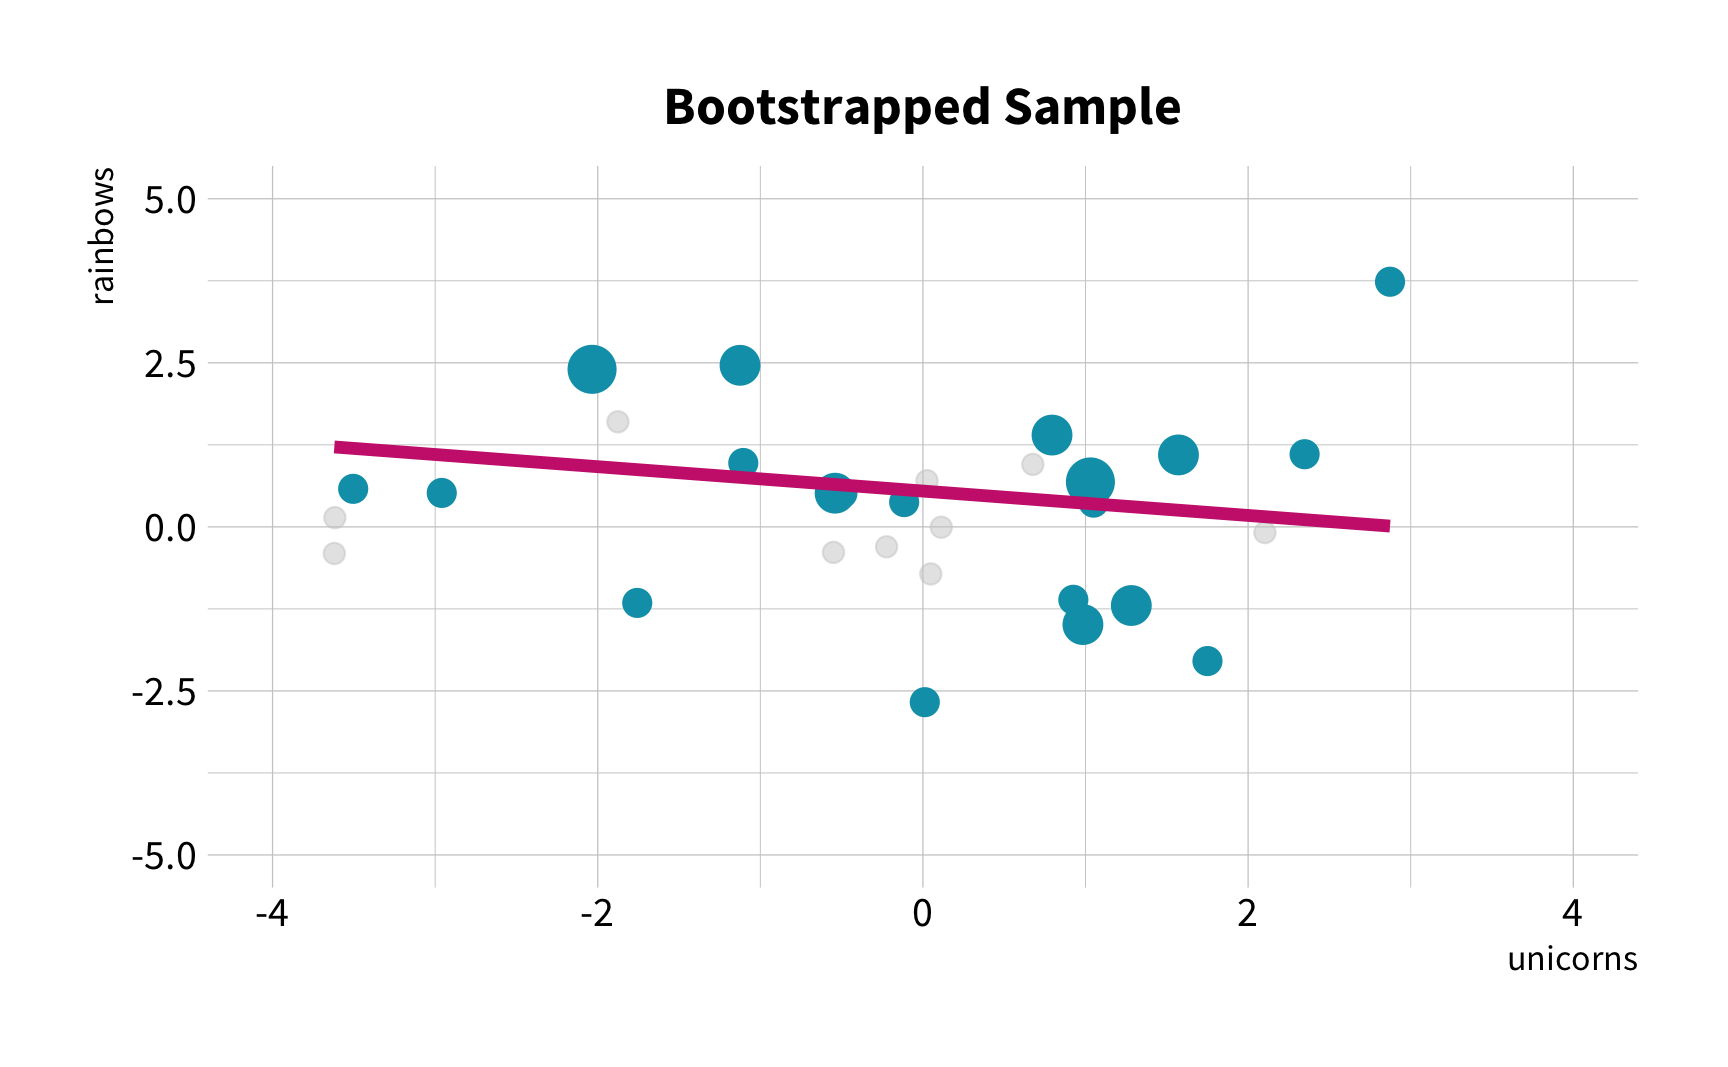
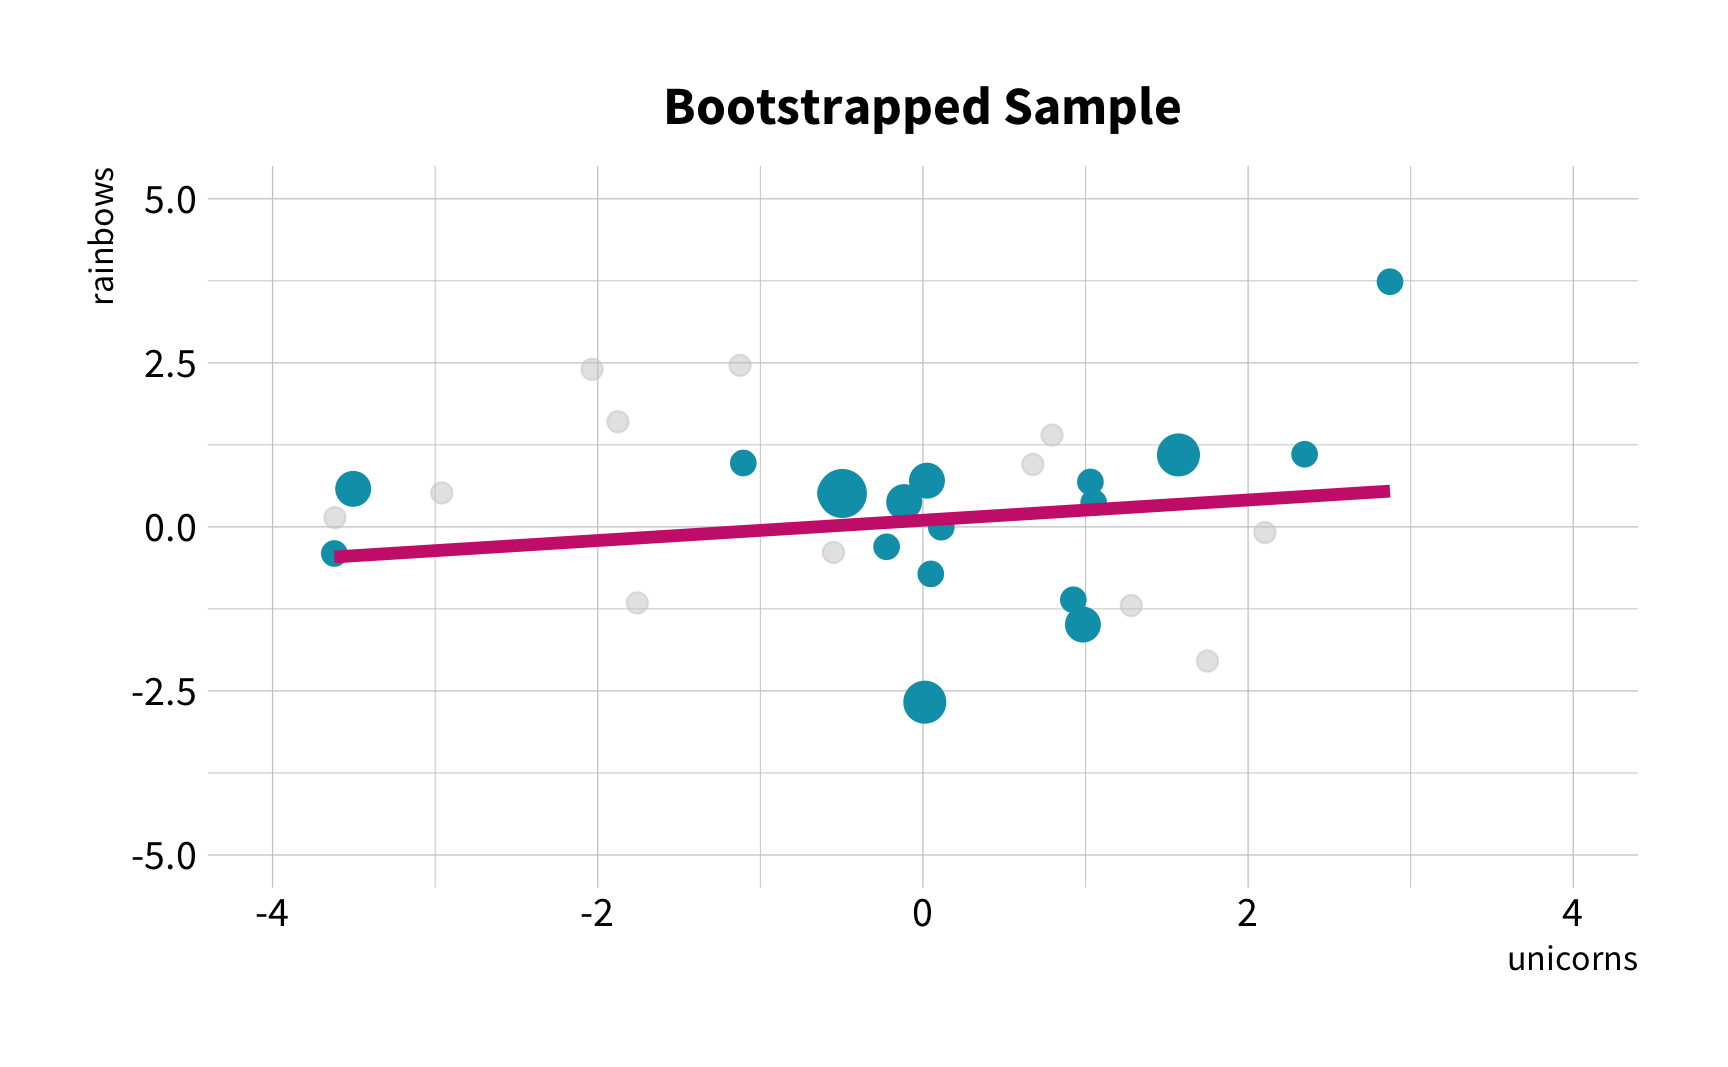
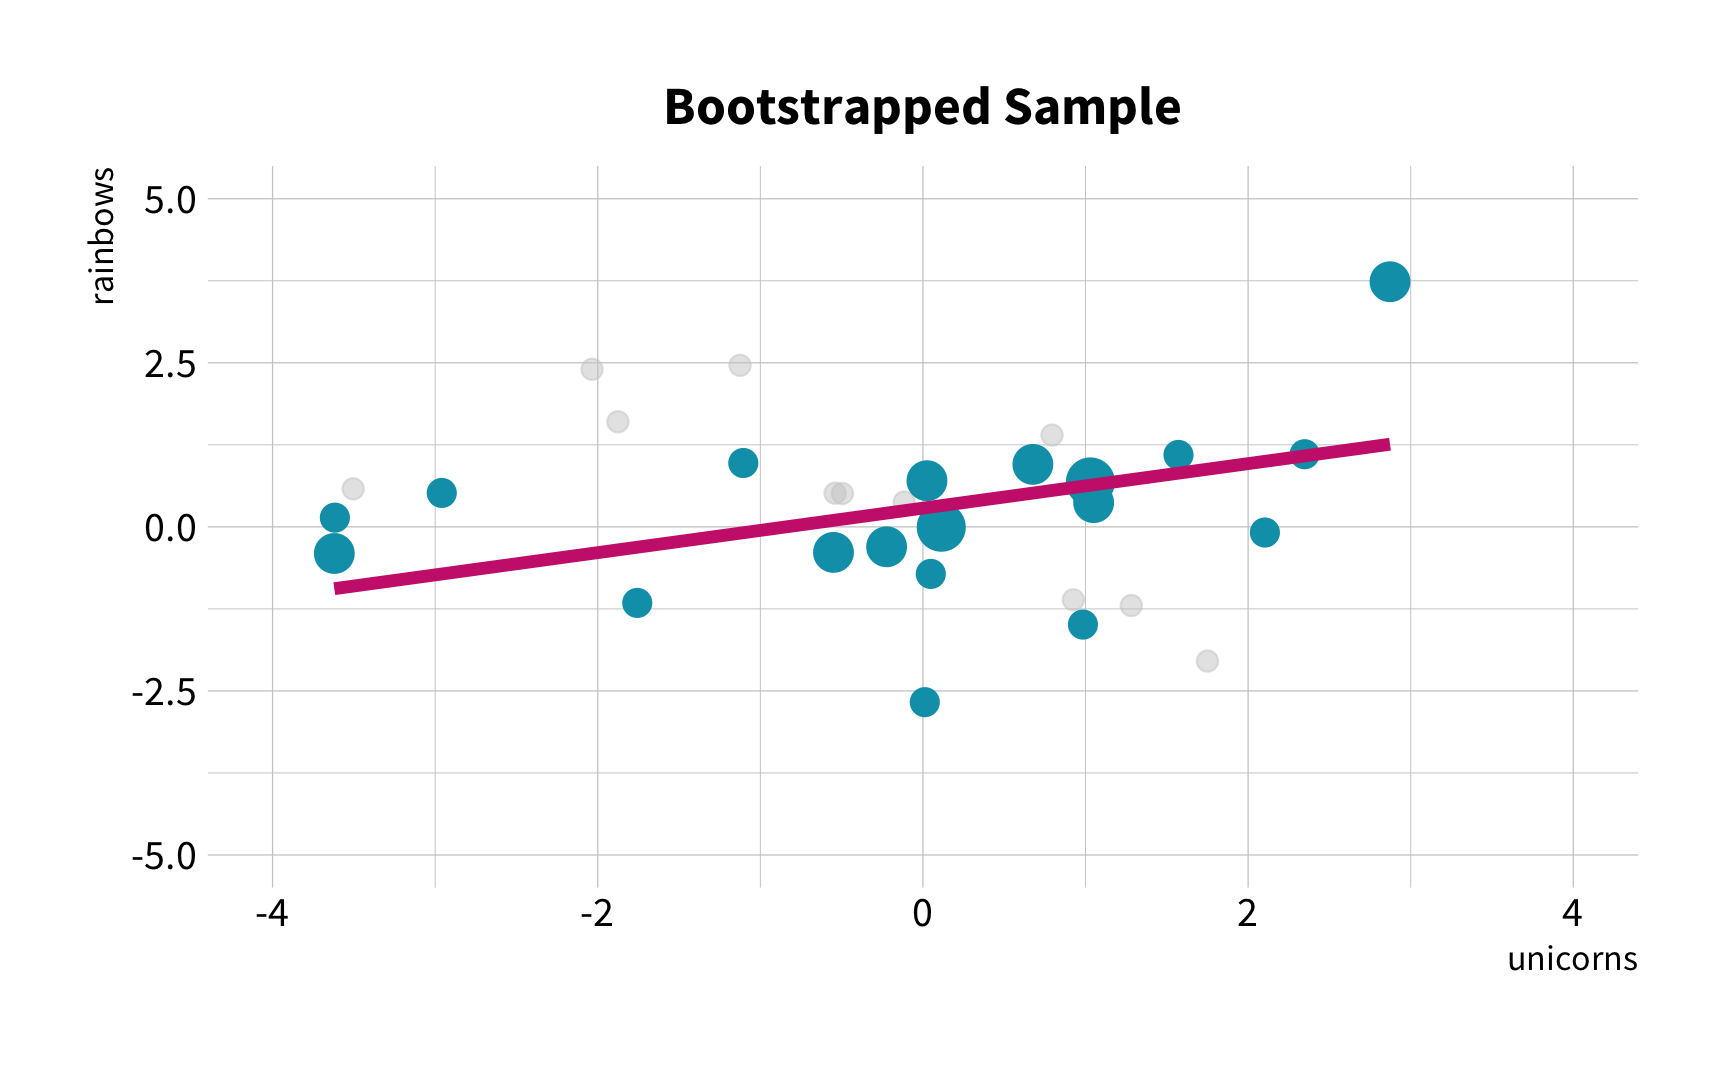
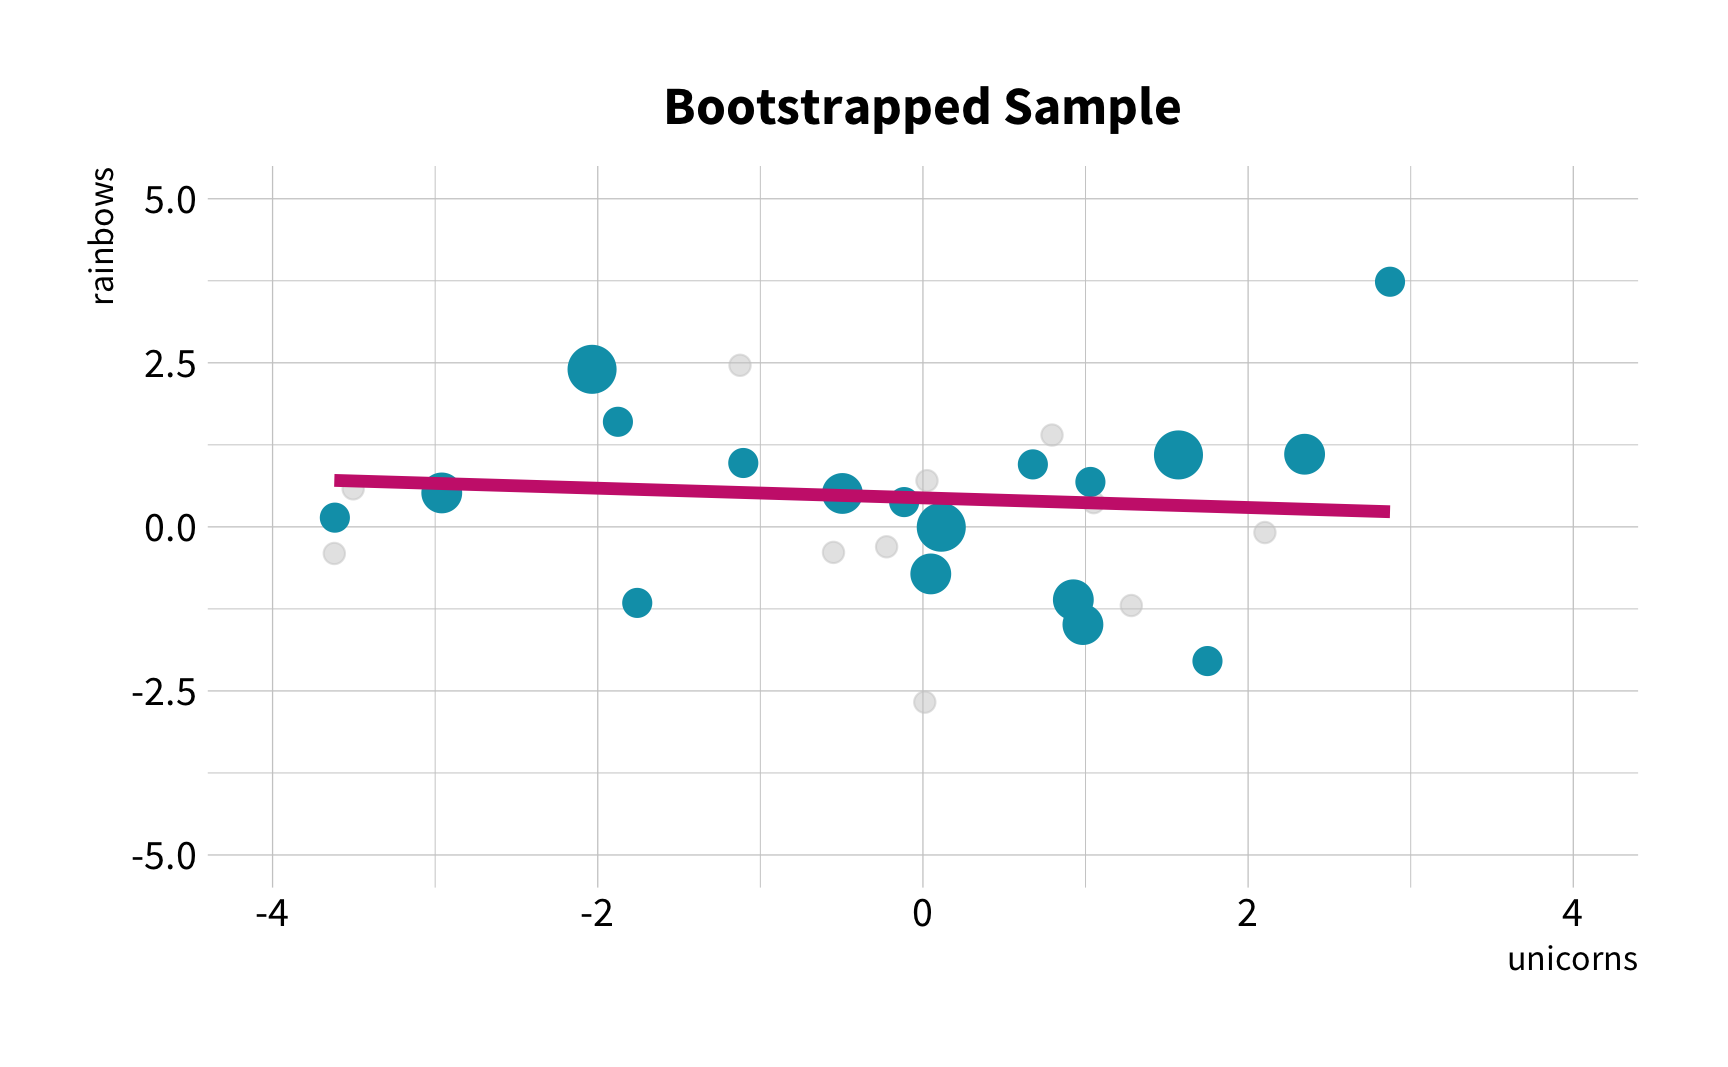
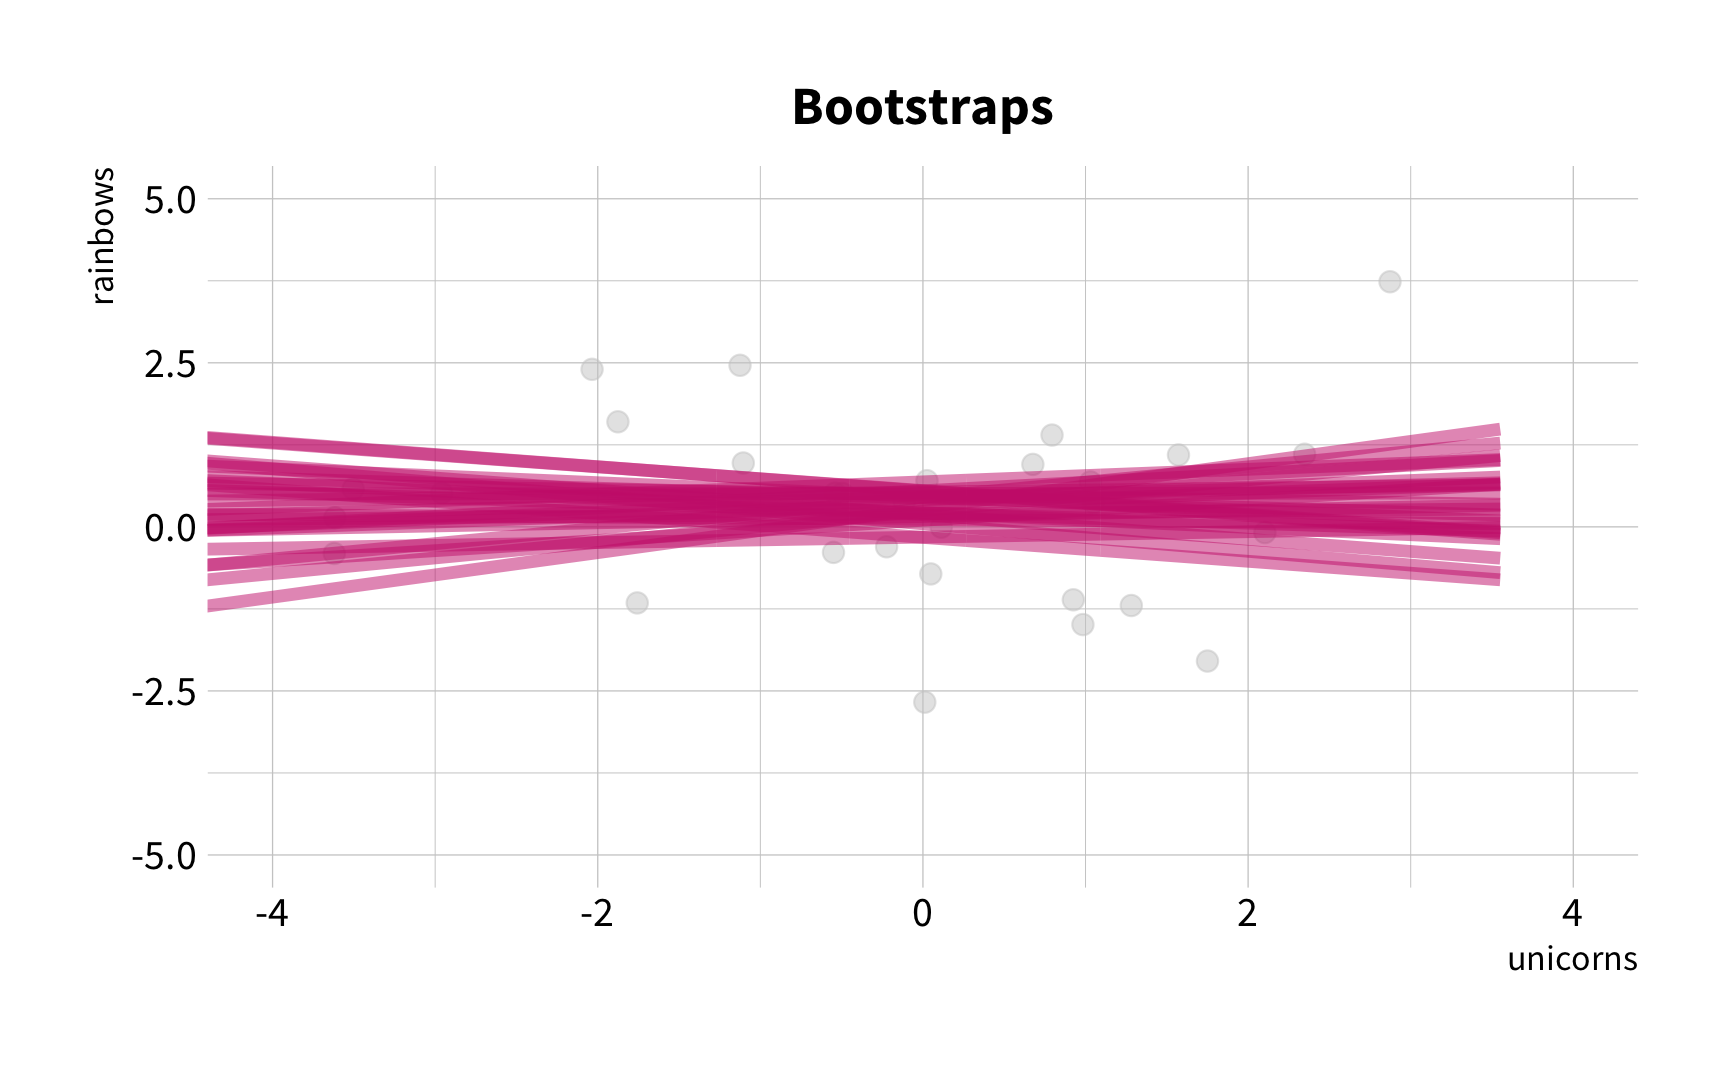
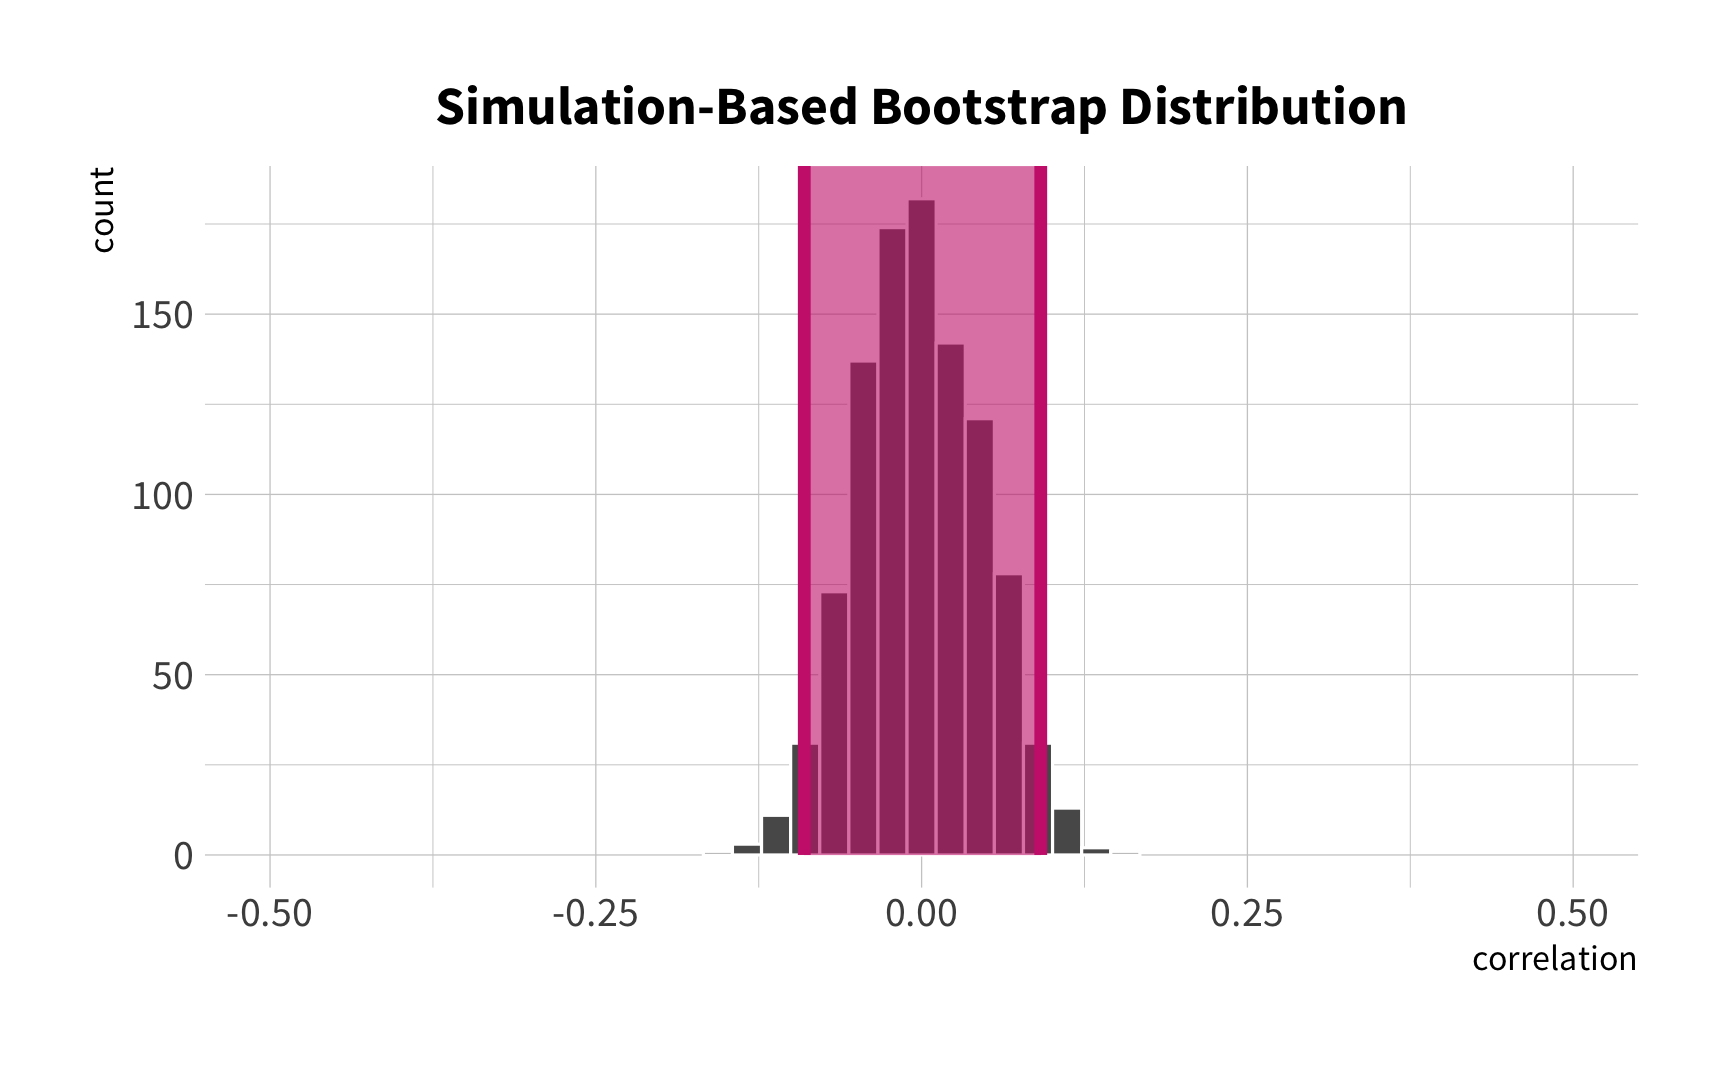
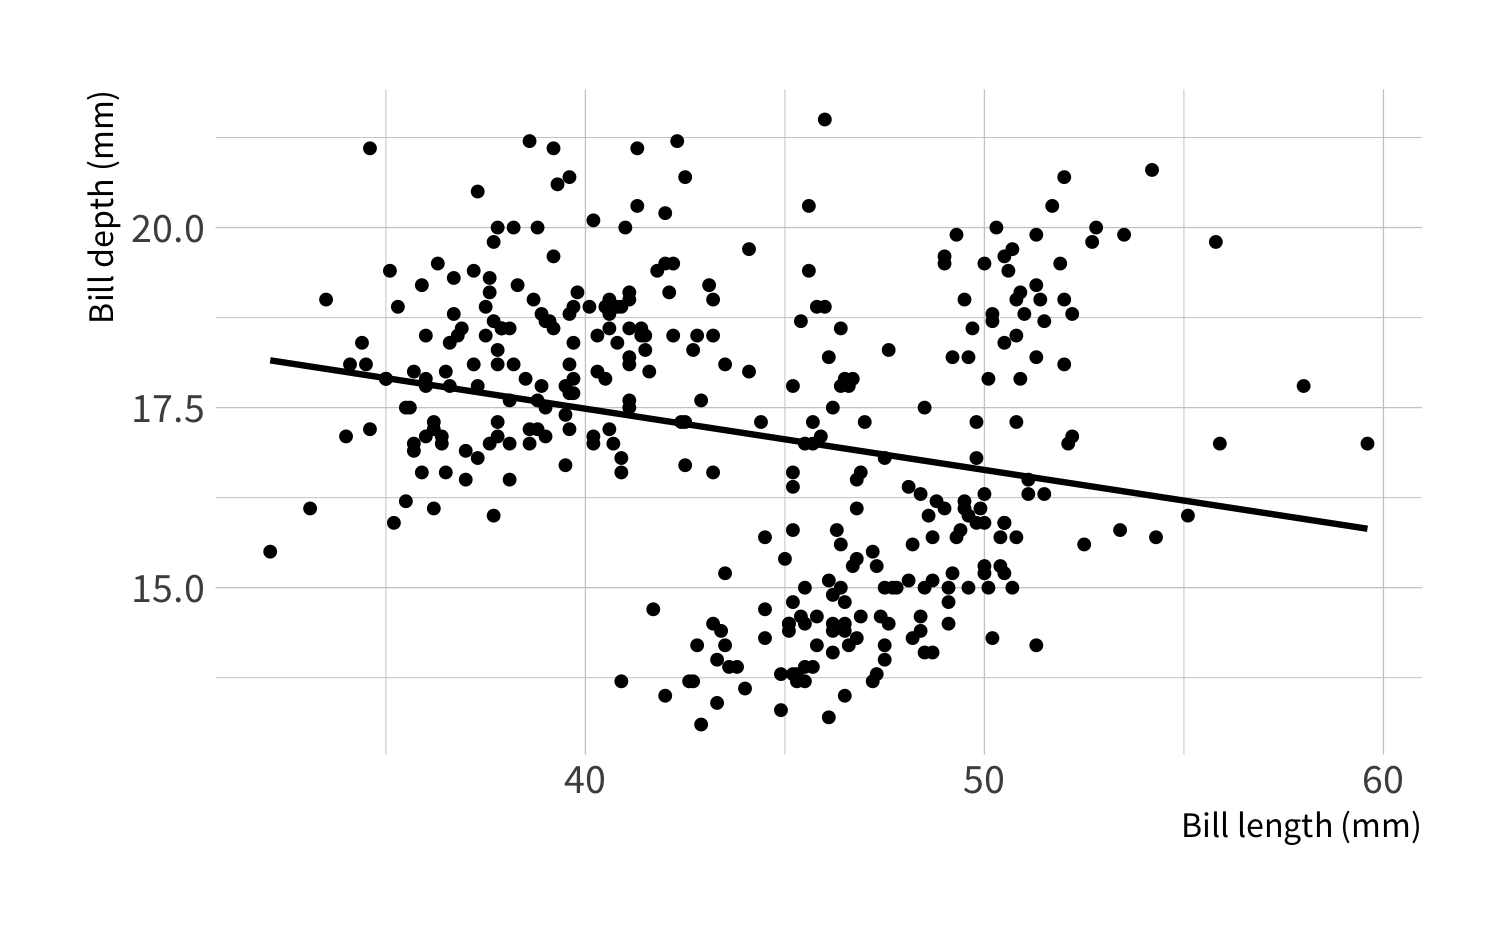
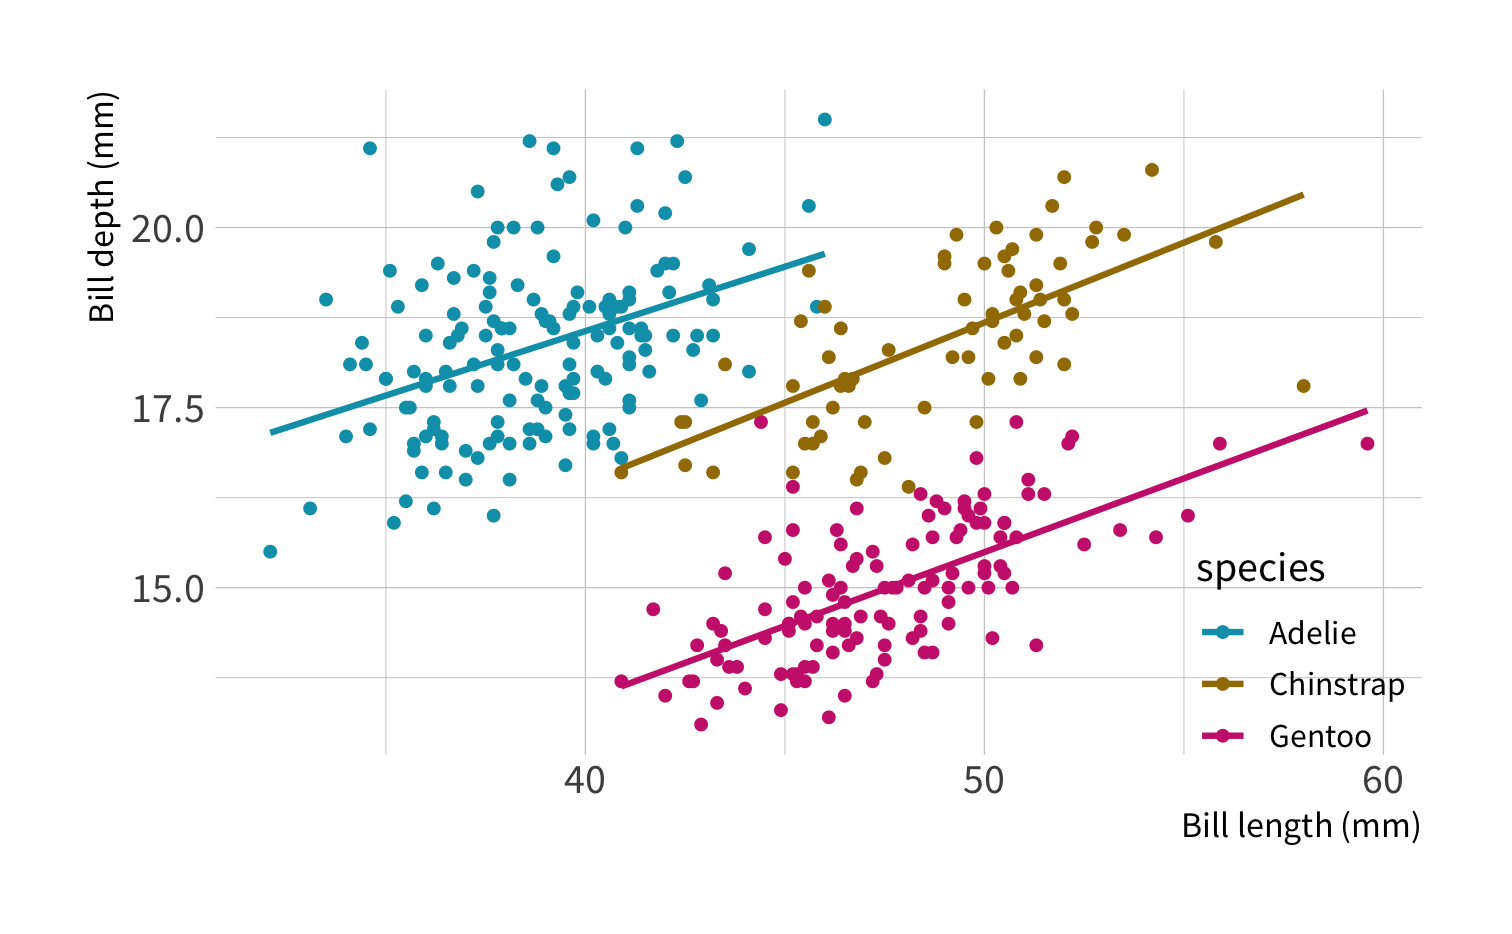
What is the correlation between bill length and bill depth?
library(palmerpenguins)penguins#> # A tibble: 344 x 8#> species island bill_length_mm bill_depth_mm flipper_length_mm body_mass_g#> <fct> <fct> <dbl> <dbl> <int> <int>#> 1 Adelie Torgersen 39.1 18.7 181 3750#> 2 Adelie Torgersen 39.5 17.4 186 3800#> 3 Adelie Torgersen 40.3 18 195 3250#> 4 Adelie Torgersen NA NA NA NA#> 5 Adelie Torgersen 36.7 19.3 193 3450#> 6 Adelie Torgersen 39.3 20.6 190 3650#> 7 Adelie Torgersen 38.9 17.8 181 3625#> 8 Adelie Torgersen 39.2 19.6 195 4675#> 9 Adelie Torgersen 34.1 18.1 193 3475#> 10 Adelie Torgersen 42 20.2 190 4250#> # … with 334 more rows, and 2 more variables: sex <fct>, year <int>Artwork by @allison_horst
bootstraps()
Create bootstrap samples from a data set.
set.seed(100) # Important!penguin_boot <- bootstraps(penguins, times = 25)Your turn 1
Use bootstraps() to create 100 bootstrap samples of the penguins data.
Save the bootstrap samples as penguin_boot.
Keep set.seed(100)!
02:00
set.seed(100)penguin_boot <- bootstraps(penguins, times = 100)penguin_boot#> # Bootstrap sampling #> # A tibble: 100 x 2#> splits id #> <list> <chr> #> 1 <split [344/134]> Bootstrap001#> 2 <split [344/126]> Bootstrap002#> 3 <split [344/124]> Bootstrap003#> 4 <split [344/129]> Bootstrap004#> 5 <split [344/127]> Bootstrap005#> 6 <split [344/124]> Bootstrap006#> 7 <split [344/127]> Bootstrap007#> 8 <split [344/125]> Bootstrap008#> 9 <split [344/128]> Bootstrap009#> 10 <split [344/123]> Bootstrap010#> # … with 90 more rowsWhat is a <list>?
penguin_boot#> # Bootstrap sampling #> # A tibble: 100 x 2#> splits id #> <list> <chr> #> 1 <split [344/134]> Bootstrap001#> 2 <split [344/126]> Bootstrap002#> 3 <split [344/124]> Bootstrap003#> 4 <split [344/129]> Bootstrap004#> 5 <split [344/127]> Bootstrap005#> 6 <split [344/124]> Bootstrap006#> 7 <split [344/127]> Bootstrap007#> 8 <split [344/125]> Bootstrap008#> 9 <split [344/128]> Bootstrap009#> 10 <split [344/123]> Bootstrap010#> # … with 90 more rowspenguin_boot$splits[[1]]
#>
#> <344/134/344>
Anatomy of a split
<344/134/344>
Anatomy of a split
<344/134/344>
<344/134/344> >>> Size of resample (analysis set)
Anatomy of a split
<344/134/344>
<344/134/344> >>> Size of resample (analysis set)
<344/134/344> >>> Size of holdout/unused data (assessment set)
Anatomy of a split
<344/134/344>
<344/134/344> >>> Size of resample (analysis set)
<344/134/344> >>> Size of holdout/unused data (assessment set)
<344/134/344> >>> Total size of data set
Split data
boot1 <- penguin_boot$splits[[1]]boot1#> <Analysis/Assess/Total>#> <344/134/344>Split data
boot1 <- penguin_boot$splits[[1]]boot1#> <Analysis/Assess/Total>#> <344/134/344>analysis()
analysis(boot1)#> # A tibble: 344 x 8#> species island bill_length_mm bill_depth_mm flipper_length_… body_mass_g#> <fct> <fct> <dbl> <dbl> <int> <int>#> 1 Gentoo Biscoe 45.2 15.8 215 5300#> 2 Adelie Biscoe 45.6 20.3 191 4600#> 3 Gentoo Biscoe 50.1 15 225 5000#> 4 Adelie Torgersen NA NA NA NA#> 5 Chinstrap Dream 49.7 18.6 195 3600#> 6 Chinstrap Dream 49.8 17.3 198 3675#> 7 Adelie Dream 40.3 18.5 196 4350#> 8 Adelie Torgersen 38.9 17.8 181 3625#> 9 Gentoo Biscoe 47.3 15.3 222 5250#> 10 Chinstrap Dream 43.2 16.6 187 2900#> # … with 334 more rows, and 2 more variables: sex <fct>, year <int>Split data
boot1 <- penguin_boot$splits[[1]]boot1#> <Analysis/Assess/Total>#> <344/134/344>analysis()
analysis(boot1)#> # A tibble: 344 x 8#> species island bill_length_mm bill_depth_mm flipper_length_… body_mass_g#> <fct> <fct> <dbl> <dbl> <int> <int>#> 1 Gentoo Biscoe 45.2 15.8 215 5300#> 2 Adelie Biscoe 45.6 20.3 191 4600#> 3 Gentoo Biscoe 50.1 15 225 5000#> 4 Adelie Torgersen NA NA NA NA#> 5 Chinstrap Dream 49.7 18.6 195 3600#> 6 Chinstrap Dream 49.8 17.3 198 3675#> 7 Adelie Dream 40.3 18.5 196 4350#> 8 Adelie Torgersen 38.9 17.8 181 3625#> 9 Gentoo Biscoe 47.3 15.3 222 5250#> 10 Chinstrap Dream 43.2 16.6 187 2900#> # … with 334 more rows, and 2 more variables: sex <fct>, year <int>assessment()
assessment(boot1)#> # A tibble: 134 x 8#> species island bill_length_mm bill_depth_mm flipper_length_mm body_mass_g#> <fct> <fct> <dbl> <dbl> <int> <int>#> 1 Adelie Torgersen 36.7 19.3 193 3450#> 2 Adelie Torgersen 39.3 20.6 190 3650#> 3 Adelie Torgersen 39.2 19.6 195 4675#> 4 Adelie Torgersen 34.1 18.1 193 3475#> 5 Adelie Torgersen 42 20.2 190 4250#> 6 Adelie Torgersen 38.7 19 195 3450#> 7 Adelie Torgersen 42.5 20.7 197 4500#> 8 Adelie Biscoe 37.7 18.7 180 3600#> 9 Adelie Biscoe 38.2 18.1 185 3950#> 10 Adelie Biscoe 40.6 18.6 183 3550#> # … with 124 more rows, and 2 more variables: sex <fct>, year <int>Pop quiz!
Why is the assessment set a different size for each bootstrap resample?
#> # Bootstrap sampling #> # A tibble: 100 x 2#> splits id #> <list> <chr> #> 1 <split [344/134]> Bootstrap001#> 2 <split [344/126]> Bootstrap002#> 3 <split [344/124]> Bootstrap003#> 4 <split [344/129]> Bootstrap004#> 5 <split [344/127]> Bootstrap005#> 6 <split [344/124]> Bootstrap006#> 7 <split [344/127]> Bootstrap007#> 8 <split [344/125]> Bootstrap008#> 9 <split [344/128]> Bootstrap009#> 10 <split [344/123]> Bootstrap010#> # … with 90 more rows01:00
Correlation
To estimate the correlation for a data set, use the cor() function.
boot1 <- penguin_boot$splits[[1]]boot_sample <- analysis(boot1)cor(boot_sample$bill_length_mm, boot_sample$bill_depth_mm)#> [1] NACorrelation
To estimate the correlation for a data set, use the cor() function.
boot1 <- penguin_boot$splits[[1]]boot_sample <- analysis(boot1)cor(boot_sample$bill_length_mm, boot_sample$bill_depth_mm)#> [1] NAcor(boot_sample$bill_length_mm, boot_sample$bill_depth_mm, use = "complete.obs")#> [1] -0.1249339Your turn 2
Complete the code to calculate the correlation for the fifth bootstrap sample.
boot5 <-
boot_sample <-         (boot5)

cor(boot_sample$              , boot_sample$             ,
    use =               )
04:00
boot5 <- penguin_boot$splits[[5]]boot_sample <- analysis(boot5)cor(boot_sample$bill_length_mm, boot_sample$bill_depth_mm, use = "complete.obs")#> [1] -0.2450851Automation
(Applied) Data Science
map() and friends
Applies a function to every element of a list.
map(.x, .f, ...)map() and friends
Applies a function to every element of a list.
map(.x, .f, ...)What output do you expect?
map_chr(), map_dbl(), map_int(), map_lgl(), map_df(), or the general map()
Building our map()
map(penguin_boot$splits, .f)
Custom functions
We need a function that:
1. Takes in a split
2. Pull out the analysis set
3. Calculates the correlation of the analysis set
Step 1: Create the code
Use our code from earlier
  boot_sample <- analysis(split)

  cor(boot_sample$bill_length_mm, boot_sample$bill_depth_mm,
      use = "complete.obs")
Step 1: Create the code
Use our code from earlier
  boot_sample <- analysis(split)

  cor(boot_sample$bill_length_mm, boot_sample$bill_depth_mm,
      use = "complete.obs")
Step 2: Wrap inside of function()
The function() function defines a new function
penguin_cor <- function(split) {
  boot_sample <- analysis(split)

  cor(boot_sample$bill_length_mm, boot_sample$bill_depth_mm,
      use = "complete.obs")
}
Step 2: Wrap inside of function()
The code gets wrapped inside of the curly braces
penguin_cor <- function(split) {
  boot_sample <- analysis(split)

  cor(boot_sample$bill_length_mm, boot_sample$bill_depth_mm,
      use = "complete.obs")
}
Step 2: Wrap inside of function()
Give the function a name
penguin_cor <- function(split) {
  boot_sample <- analysis(split)

  cor(boot_sample$bill_length_mm, boot_sample$bill_depth_mm,
      use = "complete.obs")
}
Step 3: Verify it works as expected
boot1 <- penguin_boot$splits[[1]]boot1_sample <- analysis(boot1)cor(boot1_sample$bill_length_mm, boot1_sample$bill_depth_mm, use = "complete.obs")#> [1] -0.1249339Step 3: Verify it works as expected
boot1 <- penguin_boot$splits[[1]]boot1_sample <- analysis(boot1)cor(boot1_sample$bill_length_mm, boot1_sample$bill_depth_mm, use = "complete.obs")#> [1] -0.1249339penguin_cor(boot1)#> [1] -0.1249339Building our map()
map(penguin_boot$splits, penguin_cor)#> [[1]]#> [1] -0.1249339#> #> [[2]]#> [1] -0.2541791#> #> [[3]]#> [1] -0.1991897#> #> [[4]]#> [1] -0.2478776#> #> [[5]]#> [1] -0.2450851#> #> [[6]]#> [1] -0.2792748#> #> [[7]]#> [1] -0.2776204#> #> [[8]]#> [1] -0.2045329#> #> [[9]]#> [1] -0.2431401#> #> [[10]]#> [1] -0.2745247#> #> [[11]]#> [1] -0.3171123#> #> [[12]]#> [1] -0.2259223#> #> [[13]]#> [1] -0.2044941#> #> [[14]]#> [1] -0.1027711#> #> [[15]]#> [1] -0.2506249#> #> [[16]]#> [1] -0.225205#> #> [[17]]#> [1] -0.2336472#> #> [[18]]#> [1] -0.2458328#> #> [[19]]#> [1] -0.2302427#> #> [[20]]#> [1] -0.2119384#> #> [[21]]#> [1] -0.1615742#> #> [[22]]#> [1] -0.308794#> #> [[23]]#> [1] -0.08155008#> #> [[24]]#> [1] -0.2548912#> #> [[25]]#> [1] -0.244613#> #> [[26]]#> [1] -0.2485528#> #> [[27]]#> [1] -0.23714#> #> [[28]]#> [1] -0.2015473#> #> [[29]]#> [1] -0.2691933#> #> [[30]]#> [1] -0.2407836#> #> [[31]]#> [1] -0.2307748#> #> [[32]]#> [1] -0.254897#> #> [[33]]#> [1] -0.2027794#> #> [[34]]#> [1] -0.2285699#> #> [[35]]#> [1] -0.164203#> #> [[36]]#> [1] -0.2912028#> #> [[37]]#> [1] -0.2936487#> #> [[38]]#> [1] -0.2951136#> #> [[39]]#> [1] -0.1986556#> #> [[40]]#> [1] -0.2981575#> #> [[41]]#> [1] -0.2325189#> #> [[42]]#> [1] -0.3074985#> #> [[43]]#> [1] -0.2465553#> #> [[44]]#> [1] -0.1778199#> #> [[45]]#> [1] -0.253044#> #> [[46]]#> [1] -0.2090783#> #> [[47]]#> [1] -0.2371913#> #> [[48]]#> [1] -0.2546507#> #> [[49]]#> [1] -0.2835118#> #> [[50]]#> [1] -0.2080868#> #> [[51]]#> [1] -0.2627895#> #> [[52]]#> [1] -0.198087#> #> [[53]]#> [1] -0.214096#> #> [[54]]#> [1] -0.2348333#> #> [[55]]#> [1] -0.2161979#> #> [[56]]#> [1] -0.2515138#> #> [[57]]#> [1] -0.1813075#> #> [[58]]#> [1] -0.2178123#> #> [[59]]#> [1] -0.3049228#> #> [[60]]#> [1] -0.2239921#> #> [[61]]#> [1] -0.1970032#> #> [[62]]#> [1] -0.2332788#> #> [[63]]#> [1] -0.2436859#> #> [[64]]#> [1] -0.2748855#> #> [[65]]#> [1] -0.2315254#> #> [[66]]#> [1] -0.2064697#> #> [[67]]#> [1] -0.3404718#> #> [[68]]#> [1] -0.1539548#> #> [[69]]#> [1] -0.3189776#> #> [[70]]#> [1] -0.2708725#> #> [[71]]#> [1] -0.2243308#> #> [[72]]#> [1] -0.2800821#> #> [[73]]#> [1] -0.2363227#> #> [[74]]#> [1] -0.2387688#> #> [[75]]#> [1] -0.2112919#> #> [[76]]#> [1] -0.2377676#> #> [[77]]#> [1] -0.1885858#> #> [[78]]#> [1] -0.2639419#> #> [[79]]#> [1] -0.3930653#> #> [[80]]#> [1] -0.2140946#> #> [[81]]#> [1] -0.1766409#> #> [[82]]#> [1] -0.1848252#> #> [[83]]#> [1] -0.1868983#> #> [[84]]#> [1] -0.3049031#> #> [[85]]#> [1] -0.2336121#> #> [[86]]#> [1] -0.2459616#> #> [[87]]#> [1] -0.2671155#> #> [[88]]#> [1] -0.3290882#> #> [[89]]#> [1] -0.2258902#> #> [[90]]#> [1] -0.2425831#> #> [[91]]#> [1] -0.2154876#> #> [[92]]#> [1] -0.2990681#> #> [[93]]#> [1] -0.1735009#> #> [[94]]#> [1] -0.2217043#> #> [[95]]#> [1] -0.2614308#> #> [[96]]#> [1] -0.2955381#> #> [[97]]#> [1] -0.2524951#> #> [[98]]#> [1] -0.2194297#> #> [[99]]#> [1] -0.2214609#> #> [[100]]#> [1] -0.1783059map() + mutate()
penguin_boot %>% mutate(corr = map(splits, penguin_cor))#> # Bootstrap sampling #> # A tibble: 100 x 3#> splits id corr #> <list> <chr> <list> #> 1 <split [344/134]> Bootstrap001 <dbl [1]>#> 2 <split [344/126]> Bootstrap002 <dbl [1]>#> 3 <split [344/124]> Bootstrap003 <dbl [1]>#> 4 <split [344/129]> Bootstrap004 <dbl [1]>#> 5 <split [344/127]> Bootstrap005 <dbl [1]>#> 6 <split [344/124]> Bootstrap006 <dbl [1]>#> 7 <split [344/127]> Bootstrap007 <dbl [1]>#> 8 <split [344/125]> Bootstrap008 <dbl [1]>#> 9 <split [344/128]> Bootstrap009 <dbl [1]>#> 10 <split [344/123]> Bootstrap010 <dbl [1]>#> # … with 90 more rowsWhat's wrong with this? What could be improved?
map_dbl() + mutate()
penguin_boot %>% mutate(corr = map_dbl(splits, penguin_cor))#> # Bootstrap sampling #> # A tibble: 100 x 3#> splits id corr#> <list> <chr> <dbl>#> 1 <split [344/134]> Bootstrap001 -0.125#> 2 <split [344/126]> Bootstrap002 -0.254#> 3 <split [344/124]> Bootstrap003 -0.199#> 4 <split [344/129]> Bootstrap004 -0.248#> 5 <split [344/127]> Bootstrap005 -0.245#> 6 <split [344/124]> Bootstrap006 -0.279#> 7 <split [344/127]> Bootstrap007 -0.278#> 8 <split [344/125]> Bootstrap008 -0.205#> 9 <split [344/128]> Bootstrap009 -0.243#> 10 <split [344/123]> Bootstrap010 -0.275#> # … with 90 more rowsYour turn 3
Use the mapping functions and mutate() to calculate the correlation between bill length and bill depth.
1. Write a function to calculate the correlation from the analysis set of a split.
2. Apply that function to every bootstrap sample using mutate() and mapping function.
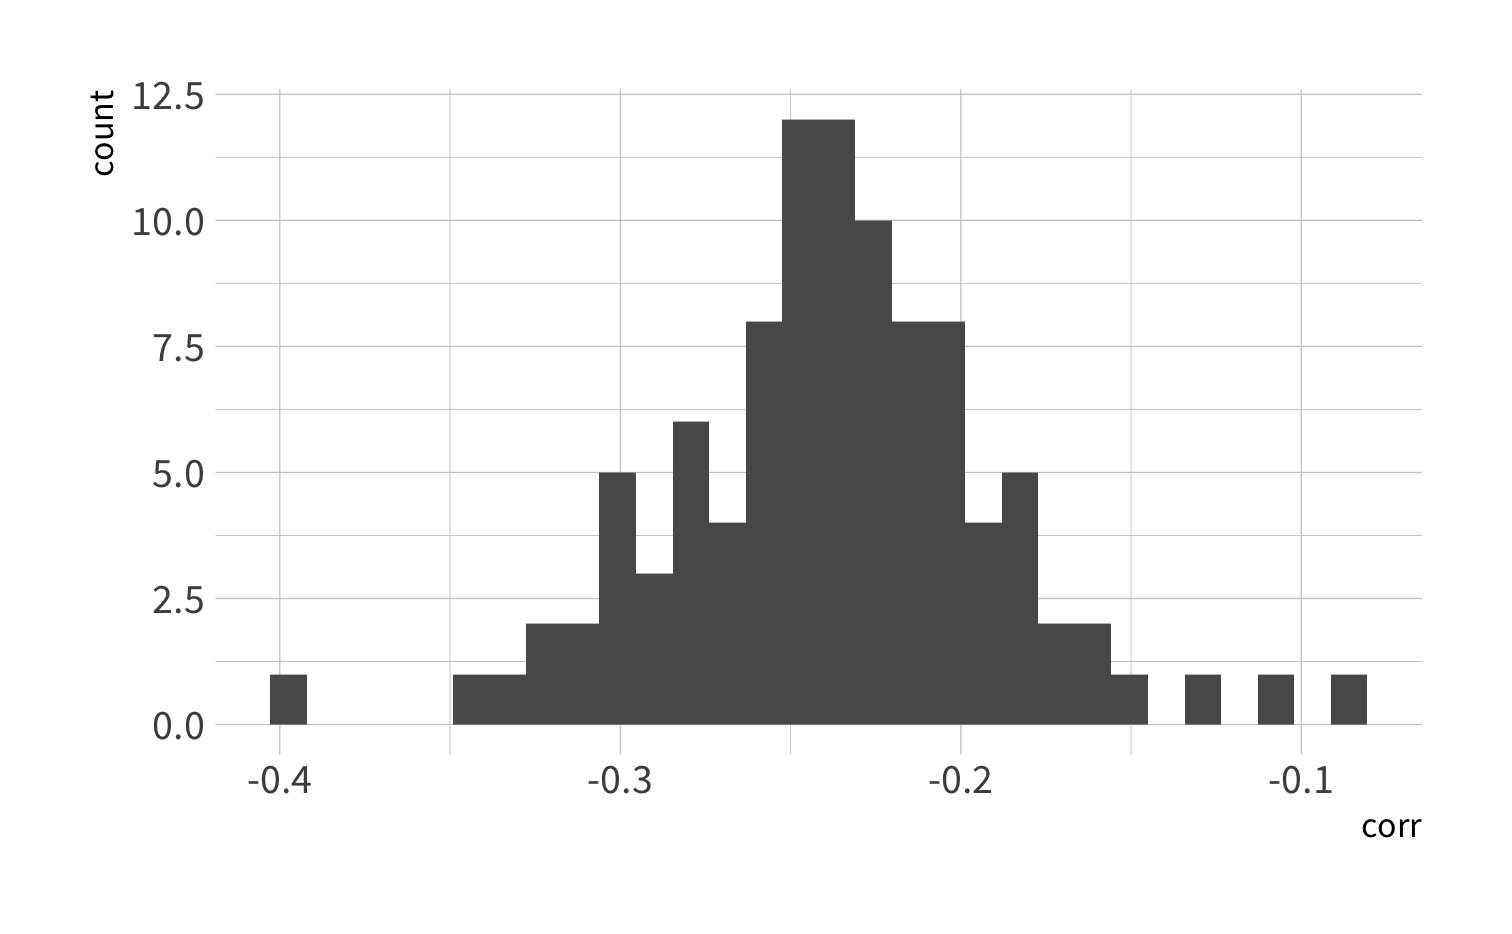
3. Make a histogram of the bootstrapped correlations.
05:00
Bootstrap summaries
penguin_boot %>% mutate(corr = map_dbl(splits, penguin_cor)) %>% summarize(avg_corr = mean(corr))#> # A tibble: 1 x 1#> avg_corr#> <dbl>#> 1 -0.237Bootstrap summaries
penguin_boot %>% mutate(corr = map_dbl(splits, penguin_cor)) %>% summarize(interval_95 = quantile(corr, probs = c(0.025, 0.975)), quantile = c(0.025, 0.975))#> # A tibble: 2 x 2#> interval_95 quantile#> <dbl> <dbl>#> 1 -0.324 0.025#> 2 -0.139 0.975Cross-validation
Your turn 4
1. Use initial_split() to create a training and testing set of the penguins data.
2. Write a parsnip specification to fit a linear model that uses flipper length to predict bill length.
3. Use the testing data to calculate the RMSE.
06:00
penguin_split <- initial_split(penguins)penguin_train <- training(penguin_split)penguin_test <- testing(penguin_split)lm_spec <- linear_reg() %>% set_engine("lm") %>% set_mode("regression")lm_model <- fit(lm_spec, bill_length_mm ~ flipper_length_mm, data = penguin_train)lm_preds <- predict(lm_model, new_data = penguin_test) %>% mutate(.truth = penguin_test$bill_length_mm)rmse(lm_preds, truth = .truth, estimate = .pred)#> # A tibble: 1 x 3#> .metric .estimator .estimate#> <chr> <chr> <dbl>#> 1 rmse standard 4.69Your turn 5
What would happen if you repeated this process? Would you get the same answers?
Rerun the code chunk from the last exercise. Do you get the same answer?
02:00
#> # A tibble: 1 x 3#> .metric .estimator .estimate#> <chr> <chr> <dbl>#> 1 rmse standard 3.66#> # A tibble: 1 x 3#> .metric .estimator .estimate#> <chr> <chr> <dbl>#> 1 rmse standard 3.91#> # A tibble: 1 x 3#> .metric .estimator .estimate#> <chr> <chr> <dbl>#> 1 rmse standard 4.61#> # A tibble: 1 x 3#> .metric .estimator .estimate#> <chr> <chr> <dbl>#> 1 rmse standard 3.66#> # A tibble: 1 x 3#> .metric .estimator .estimate#> <chr> <chr> <dbl>#> 1 rmse standard 3.91#> # A tibble: 1 x 3#> .metric .estimator .estimate#> <chr> <chr> <dbl>#> 1 rmse standard 4.61#> # A tibble: 1 x 3#> .metric .estimator .estimate#> <chr> <chr> <dbl>#> 1 rmse standard 4.16#> # A tibble: 1 x 3#> .metric .estimator .estimate#> <chr> <chr> <dbl>#> 1 rmse standard 4.01#> # A tibble: 1 x 3#> .metric .estimator .estimate#> <chr> <chr> <dbl>#> 1 rmse standard 3.88Pop quiz!
Why is the new estimate different?


Mean RMSE
rmses %>% enframe(name = "rmse")#> # A tibble: 10 x 2#> rmse value#> <int> <dbl>#> 1 1 3.72#> 2 2 3.65#> 3 3 4.70#> 4 4 4.31#> 5 5 3.82#> 6 6 4.39#> 7 7 4.08#> 8 8 4.85#> 9 9 4.57#> 10 10 4.08mean(rmses)#> [1] 4.216917Consider
Which do you think is more accurate, the best result or the mean of the results? Why?
There has to be a better way...
rmses <- vector(length = 10, mode = "double")for (i in seq_along(rmses)) { new_split <- initial_split(penguins) penguin_train <- training(new_split) penguin_test <- testing(new_split) lm_model <- fit(lm_spec, bill_length_mm ~ flipper_length_mm, data = penguin_train) lm_preds <- predict(lm_model, new_data = penguin_test) %>% mutate(.truth = penguin_test$bill_length_mm) rmses[i] <- rmse(lm_preds, truth = .truth, estimate = .pred) %>% pull(.estimate)}V-fold cross-validation
vfold_cv(data, v = 10, ...)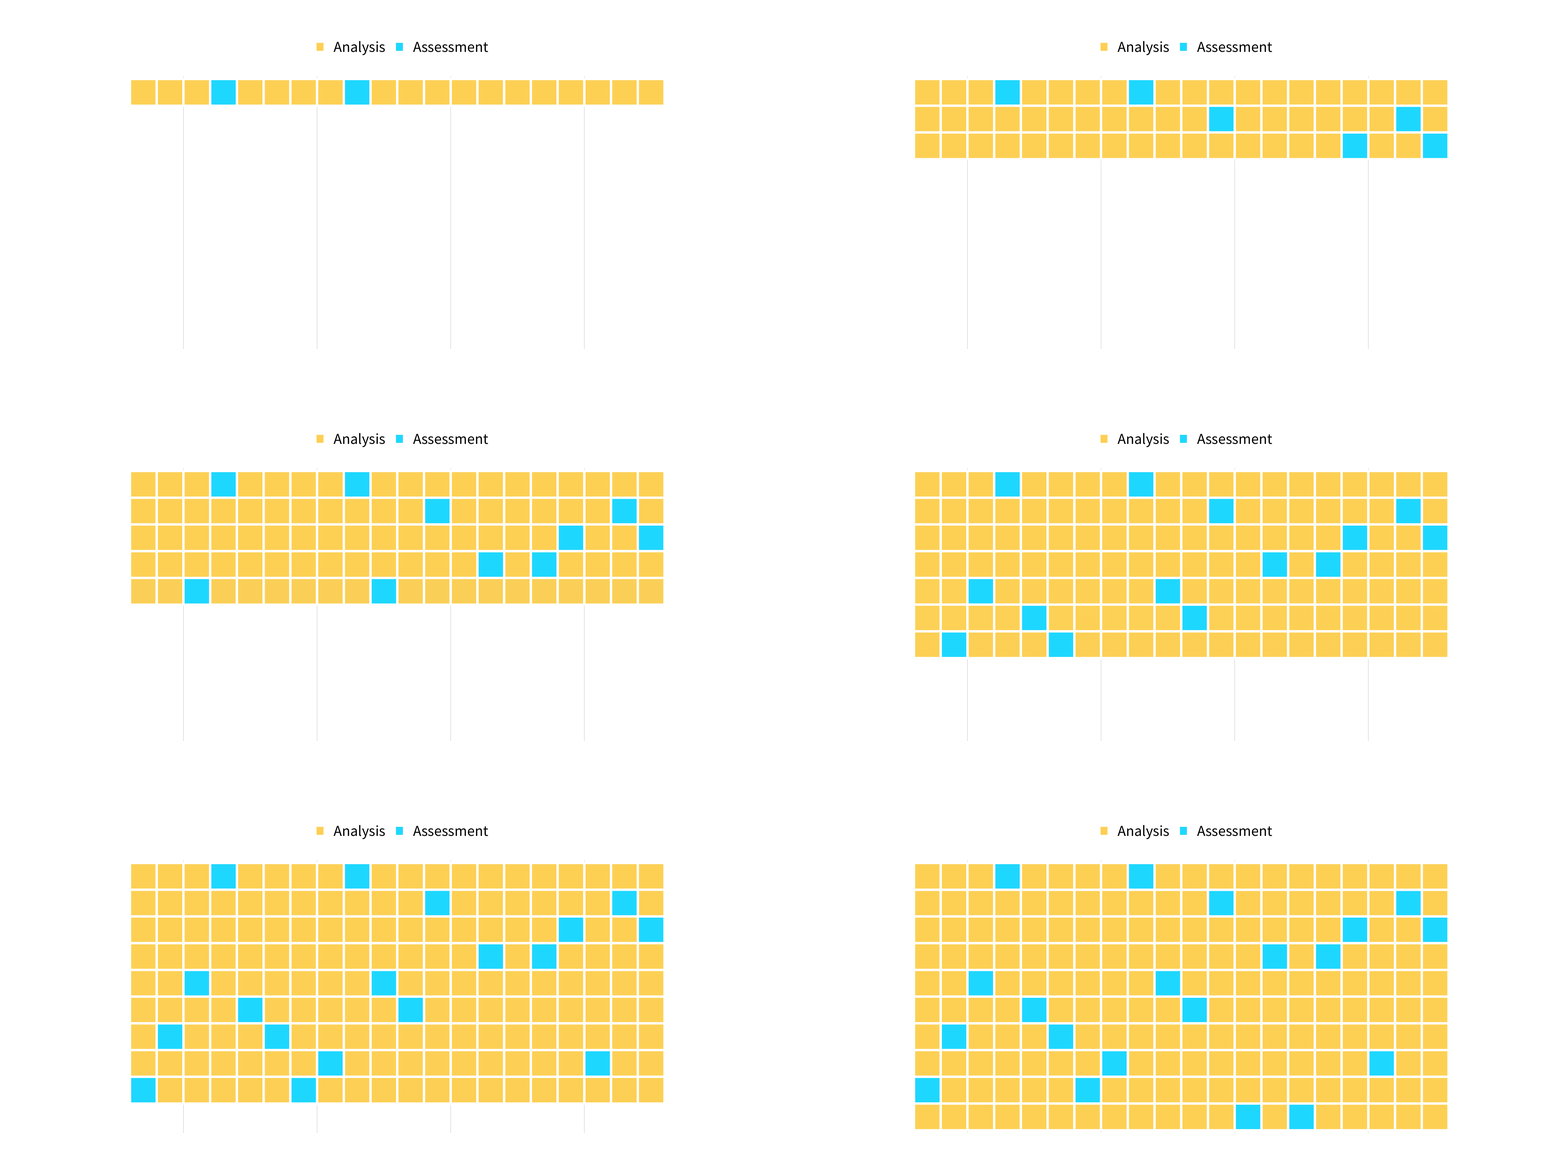
Guess
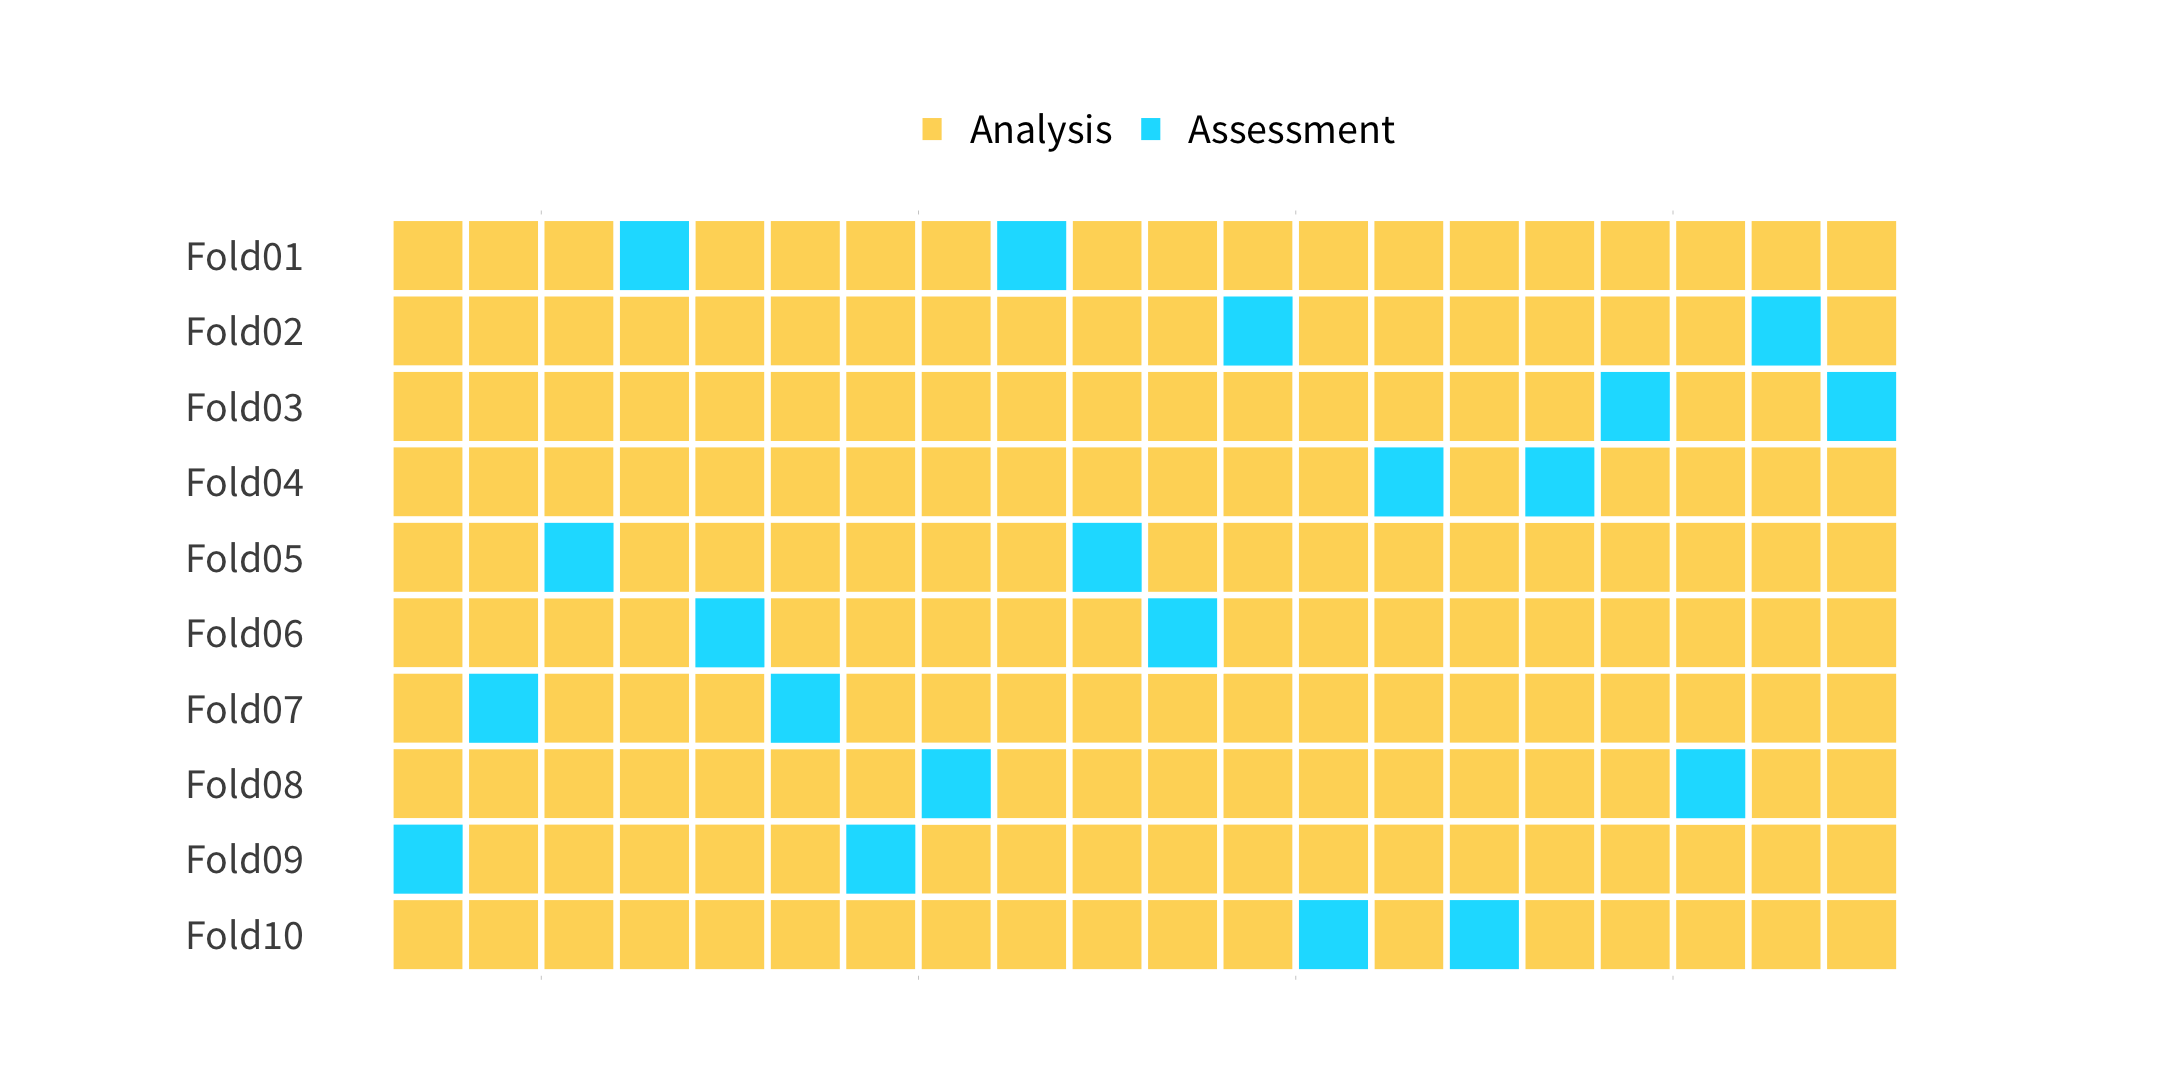
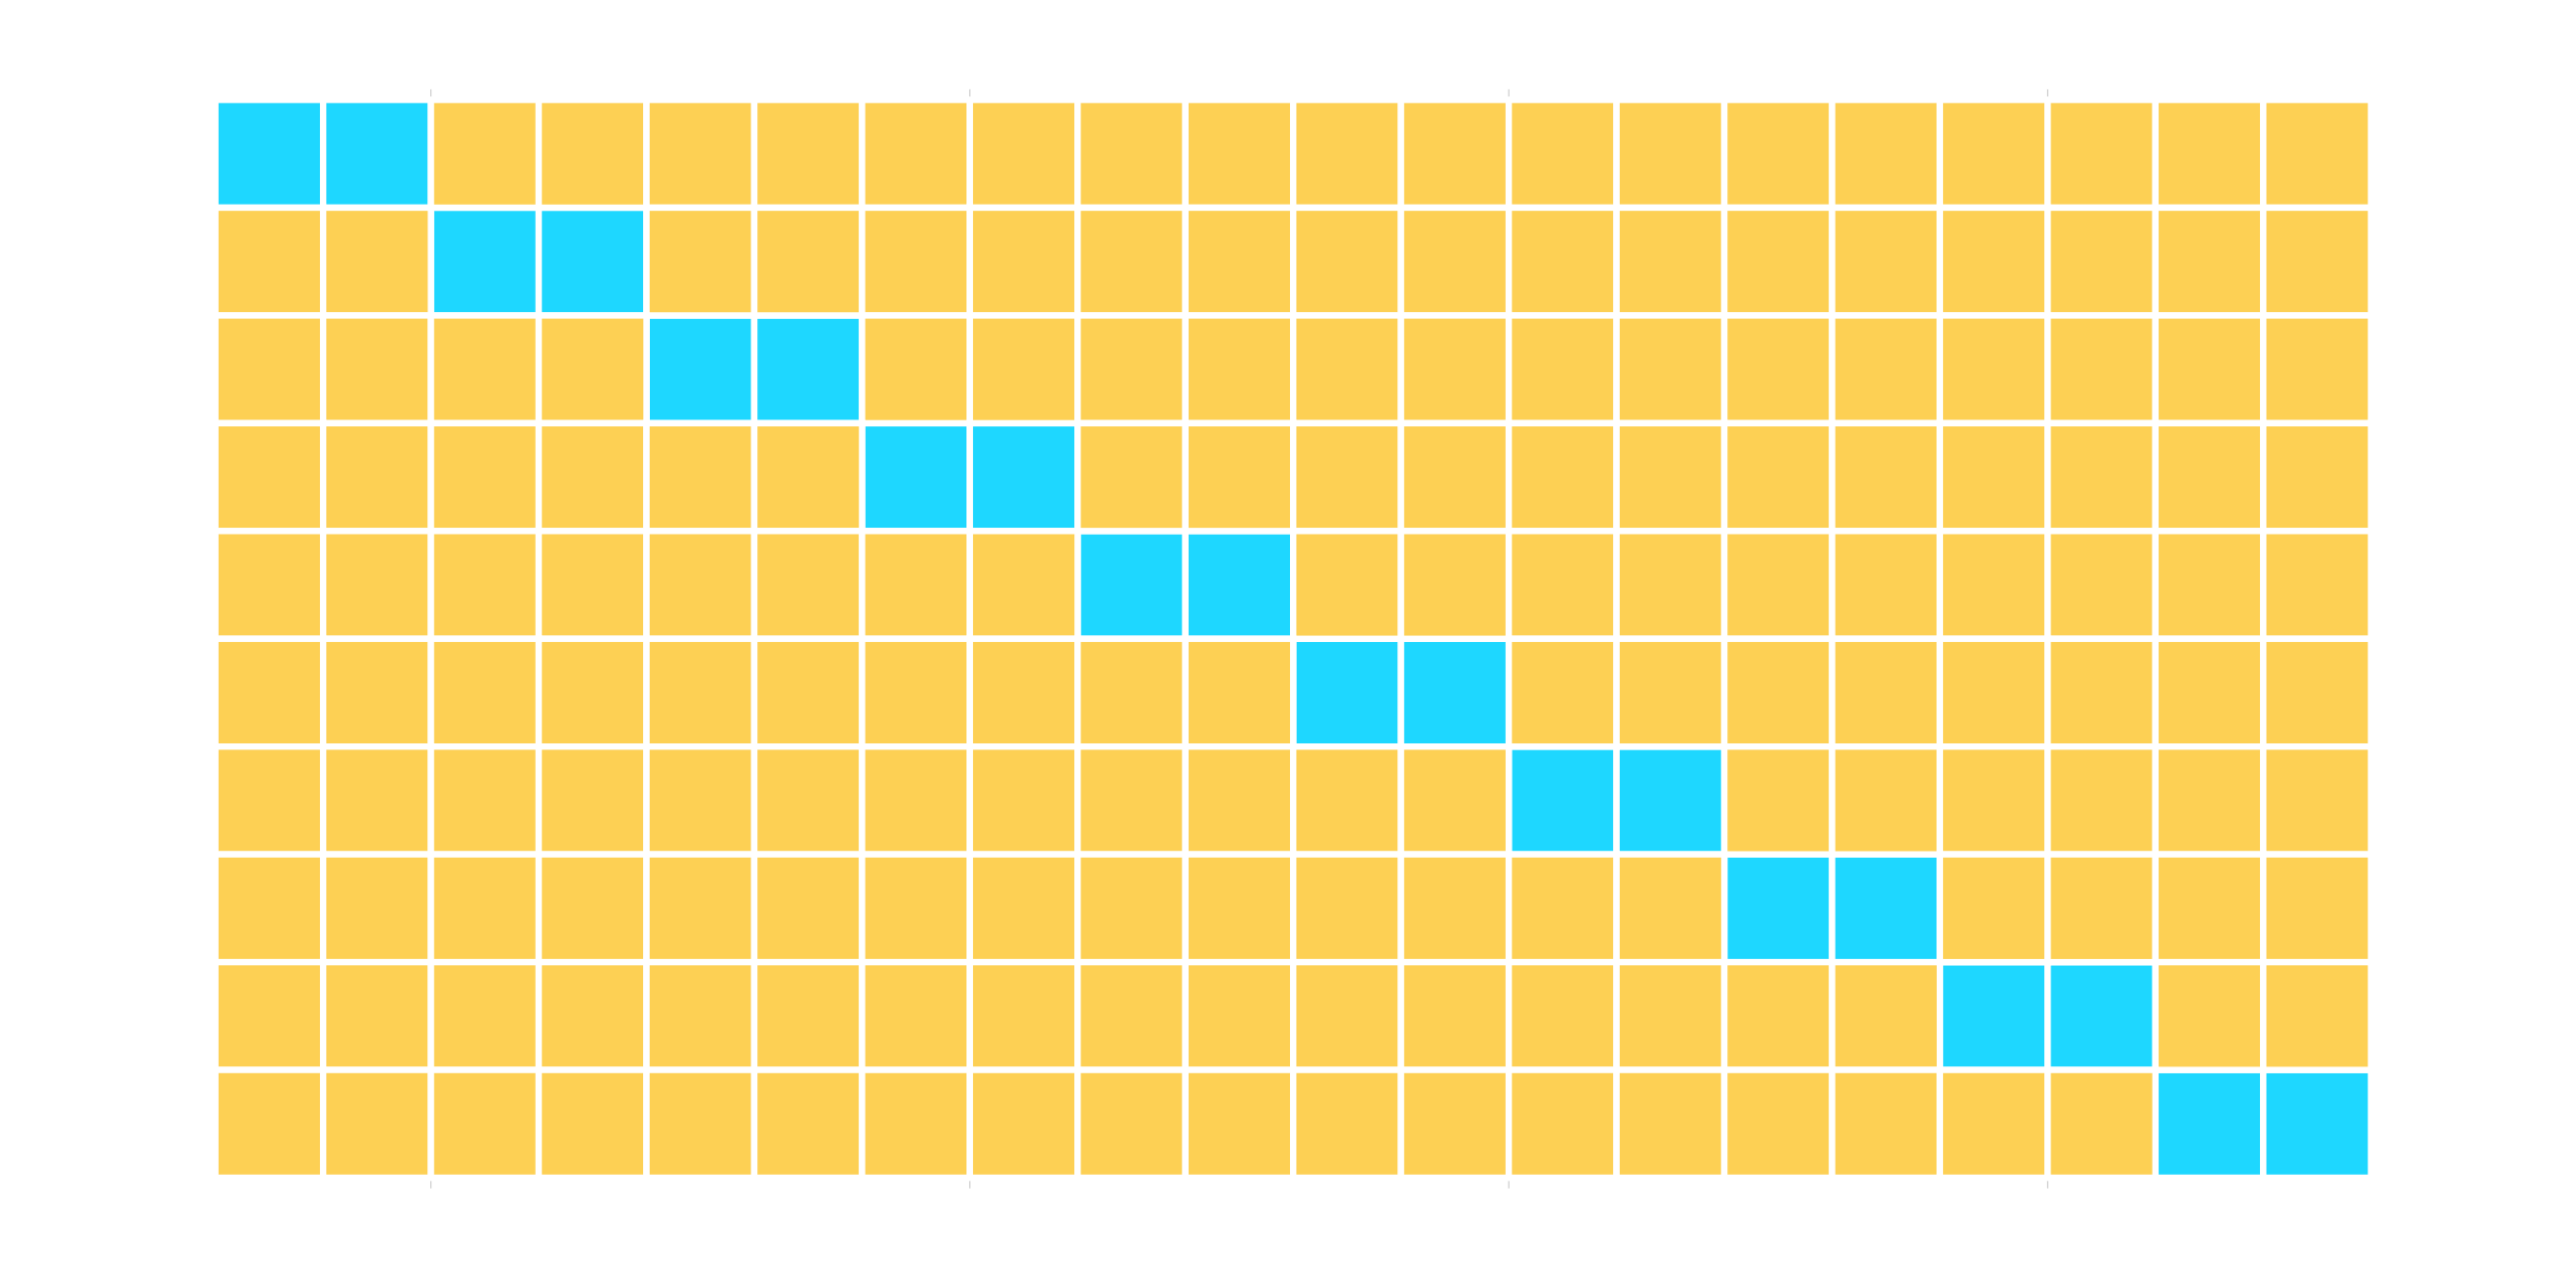
How many times does an observation/row appear in the assessment set?
Pop quiz!
If we use 10 folds, what percent of our data will end up in the training set and what percent in the testing set for each fold?
01:00
Pop quiz!
If we use 10 folds, what percent of our data will end up in the training set and what percent in the testing set for each fold?
90% training
10% testing
Your turn 6
Run the code below. What does it return?
set.seed(100)cv_folds <- vfold_cv(penguins, v = 10, strata = species)cv_folds01:00
cv_folds#> # 10-fold cross-validation using stratification #> # A tibble: 10 x 2#> splits id #> <list> <chr> #> 1 <split [308/36]> Fold01#> 2 <split [308/36]> Fold02#> 3 <split [309/35]> Fold03#> 4 <split [309/35]> Fold04#> 5 <split [310/34]> Fold05#> 6 <split [310/34]> Fold06#> 7 <split [310/34]> Fold07#> 8 <split [310/34]> Fold08#> 9 <split [311/33]> Fold09#> 10 <split [311/33]> Fold10How does this help us?
fit_resamples()
fit_resamples()
Trains and tests a model with cross-validation.
fit_resamples(lm_spec, bill_length_mm ~ flipper_length_mm, resamples = cv_folds)fit_resamples(lm_spec, bill_length_mm ~ flipper_length_mm, resamples = cv_folds)#> # Resampling results#> # 10-fold cross-validation using stratification #> # A tibble: 10 x 4#> splits id .metrics .notes #> <list> <chr> <list> <list> #> 1 <split [308/36]> Fold01 <tibble[,4] [2 × 4]> <tibble[,1] [0 × 1]>#> 2 <split [308/36]> Fold02 <tibble[,4] [2 × 4]> <tibble[,1] [0 × 1]>#> 3 <split [309/35]> Fold03 <tibble[,4] [2 × 4]> <tibble[,1] [0 × 1]>#> 4 <split [309/35]> Fold04 <tibble[,4] [2 × 4]> <tibble[,1] [0 × 1]>#> 5 <split [310/34]> Fold05 <tibble[,4] [2 × 4]> <tibble[,1] [0 × 1]>#> 6 <split [310/34]> Fold06 <tibble[,4] [2 × 4]> <tibble[,1] [0 × 1]>#> 7 <split [310/34]> Fold07 <tibble[,4] [2 × 4]> <tibble[,1] [0 × 1]>#> 8 <split [310/34]> Fold08 <tibble[,4] [2 × 4]> <tibble[,1] [0 × 1]>#> 9 <split [311/33]> Fold09 <tibble[,4] [2 × 4]> <tibble[,1] [0 × 1]>#> 10 <split [311/33]> Fold10 <tibble[,4] [2 × 4]> <tibble[,1] [0 × 1]>collect_metrics()
Collect metrics from a cross-validation.
cv_results %>% collect_metrics()#> # A tibble: 2 x 6#> .metric .estimator mean n std_err .config #> <chr> <chr> <dbl> <int> <dbl> <chr> #> 1 rmse standard 4.11 10 0.158 Preprocessor1_Model1#> 2 rsq standard 0.444 10 0.0422 Preprocessor1_Model1collect_metrics()
Collect metrics from a cross-validation.
cv_results %>% collect_metrics()#> # A tibble: 2 x 6#> .metric .estimator mean n std_err .config #> <chr> <chr> <dbl> <int> <dbl> <chr> #> 1 rmse standard 4.11 10 0.158 Preprocessor1_Model1#> 2 rsq standard 0.444 10 0.0422 Preprocessor1_Model1cv_results %>% collect_metrics(summarize = FALSE)#> # A tibble: 20 x 5#> id .metric .estimator .estimate .config #> <chr> <chr> <chr> <dbl> <chr> #> 1 Fold01 rmse standard 3.77 Preprocessor1_Model1#> 2 Fold01 rsq standard 0.451 Preprocessor1_Model1#> 3 Fold02 rmse standard 4.43 Preprocessor1_Model1#> 4 Fold02 rsq standard 0.295 Preprocessor1_Model1#> 5 Fold03 rmse standard 3.83 Preprocessor1_Model1#> 6 Fold03 rsq standard 0.315 Preprocessor1_Model1#> 7 Fold04 rmse standard 4.16 Preprocessor1_Model1#> 8 Fold04 rsq standard 0.496 Preprocessor1_Model1#> 9 Fold05 rmse standard 4.16 Preprocessor1_Model1#> 10 Fold05 rsq standard 0.560 Preprocessor1_Model1#> 11 Fold06 rmse standard 5.11 Preprocessor1_Model1#> 12 Fold06 rsq standard 0.220 Preprocessor1_Model1#> 13 Fold07 rmse standard 4.24 Preprocessor1_Model1#> 14 Fold07 rsq standard 0.594 Preprocessor1_Model1#> 15 Fold08 rmse standard 4.45 Preprocessor1_Model1#> 16 Fold08 rsq standard 0.387 Preprocessor1_Model1#> 17 Fold09 rmse standard 3.56 Preprocessor1_Model1#> 18 Fold09 rsq standard 0.593 Preprocessor1_Model1#> 19 Fold10 rmse standard 3.39 Preprocessor1_Model1#> 20 Fold10 rsq standard 0.528 Preprocessor1_Model1metric_set()
Specify which metrics you want to get back.
fit_resamples(lm_spec, bill_length_mm ~ flipper_length_mm, resamples = cv_folds, metrics = metric_set(rsq)) %>% collect_metrics()#> # A tibble: 1 x 6#> .metric .estimator mean n std_err .config #> <chr> <chr> <dbl> <int> <dbl> <chr> #> 1 rsq standard 0.444 10 0.0422 Preprocessor1_Model1Your Turn 7
Modify the code below to estimate our model on each of the folds and calculate the average RMSE for our penguin model.
fit(lm_spec, bill_length_mm ~ flipper_length_mm, data = penguins)03:00
fit_resamples(lm_spec, bill_length_mm ~ flipper_length_mm, resamples = cv_folds, metrics = metric_set(rmse)) %>% collect_metrics()#> # A tibble: 1 x 6#> .metric .estimator mean n std_err .config #> <chr> <chr> <dbl> <int> <dbl> <chr> #> 1 rmse standard 4.11 10 0.158 Preprocessor1_Model1Comparing Models
Your Turn 8
Use fit_resamples() and cv_folds to estimate to models two predict bill length.
1. bill_length_mm ~ flipper_length_mm
2. bill_length_mm ~ species + sex
Compare the performance of each.
06:00
fit_resamples(lm_spec, bill_length_mm ~ flipper_length_mm, resamples = cv_folds) %>% collect_metrics()#> # A tibble: 2 x 6#> .metric .estimator mean n std_err .config #> <chr> <chr> <dbl> <int> <dbl> <chr> #> 1 rmse standard 4.11 10 0.158 Preprocessor1_Model1#> 2 rsq standard 0.444 10 0.0422 Preprocessor1_Model1fit_resamples(lm_spec, bill_length_mm ~ species + sex, resamples = cv_folds) %>% collect_metrics()#> # A tibble: 2 x 6#> .metric .estimator mean n std_err .config #> <chr> <chr> <dbl> <int> <dbl> <chr> #> 1 rmse standard 2.33 10 0.118 Preprocessor1_Model1#> 2 rsq standard 0.833 10 0.0130 Preprocessor1_Model1Pop quiz!
Why should you use the same data splits to compare each model?
Pop quiz!
Why should you use the same data splits to compare each model?
🍎 to 🍎
Pop quiz!
Does cross-validation measure just the accuracy of your model, or your entire workflow?
Pop quiz!
Does cross-validation measure just the accuracy of your model, or your entire workflow?
Your entire workflow
Other types of cross-validation
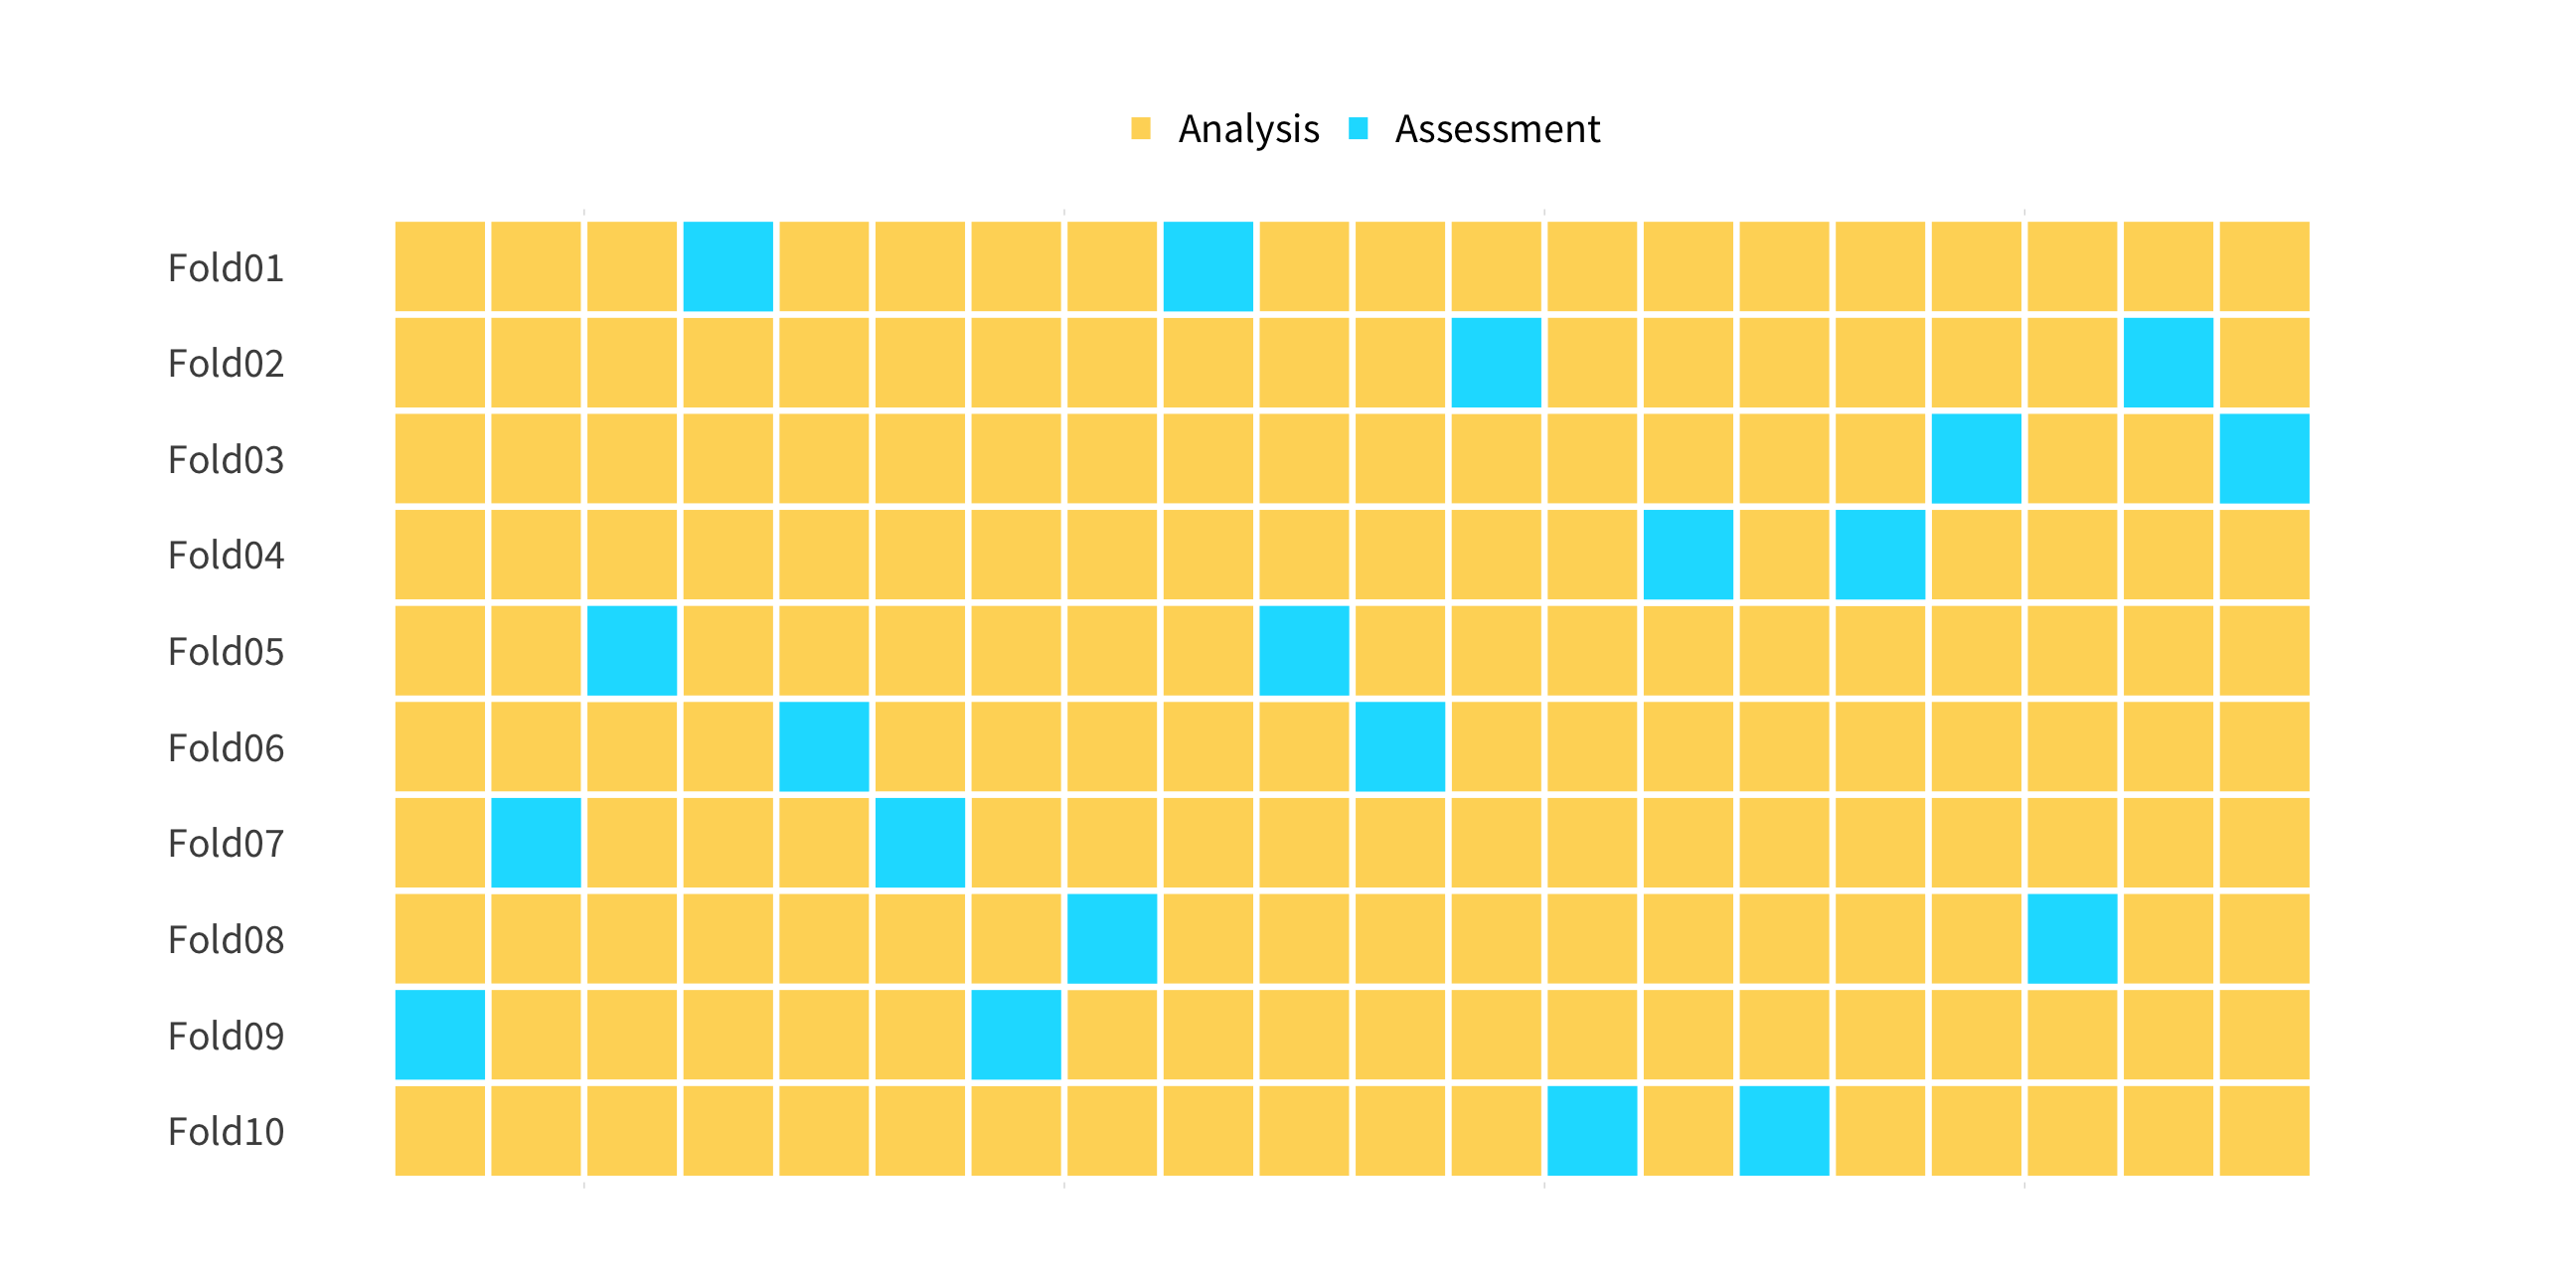
vfold_cv() - V Fold cross-validation
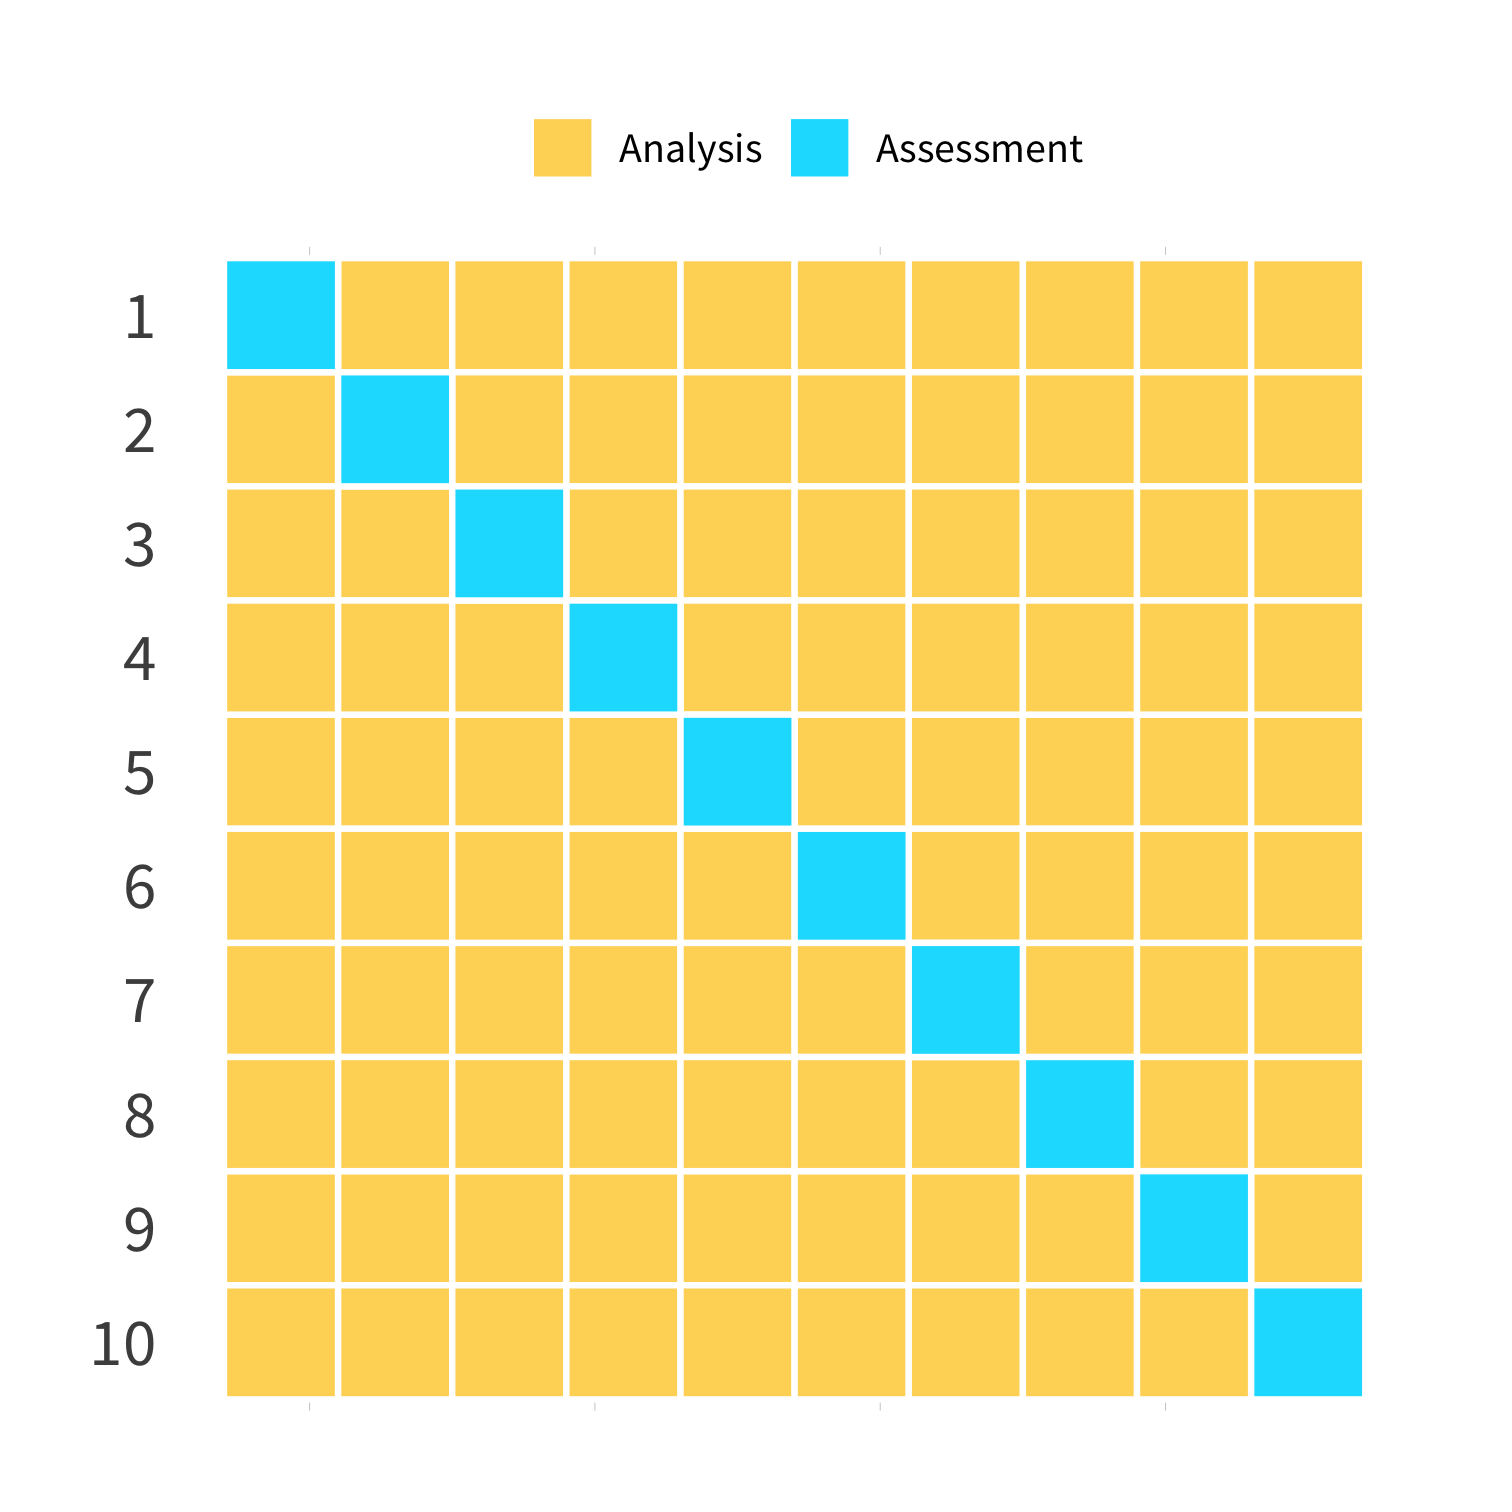
loo_cv() - Leave one out CV
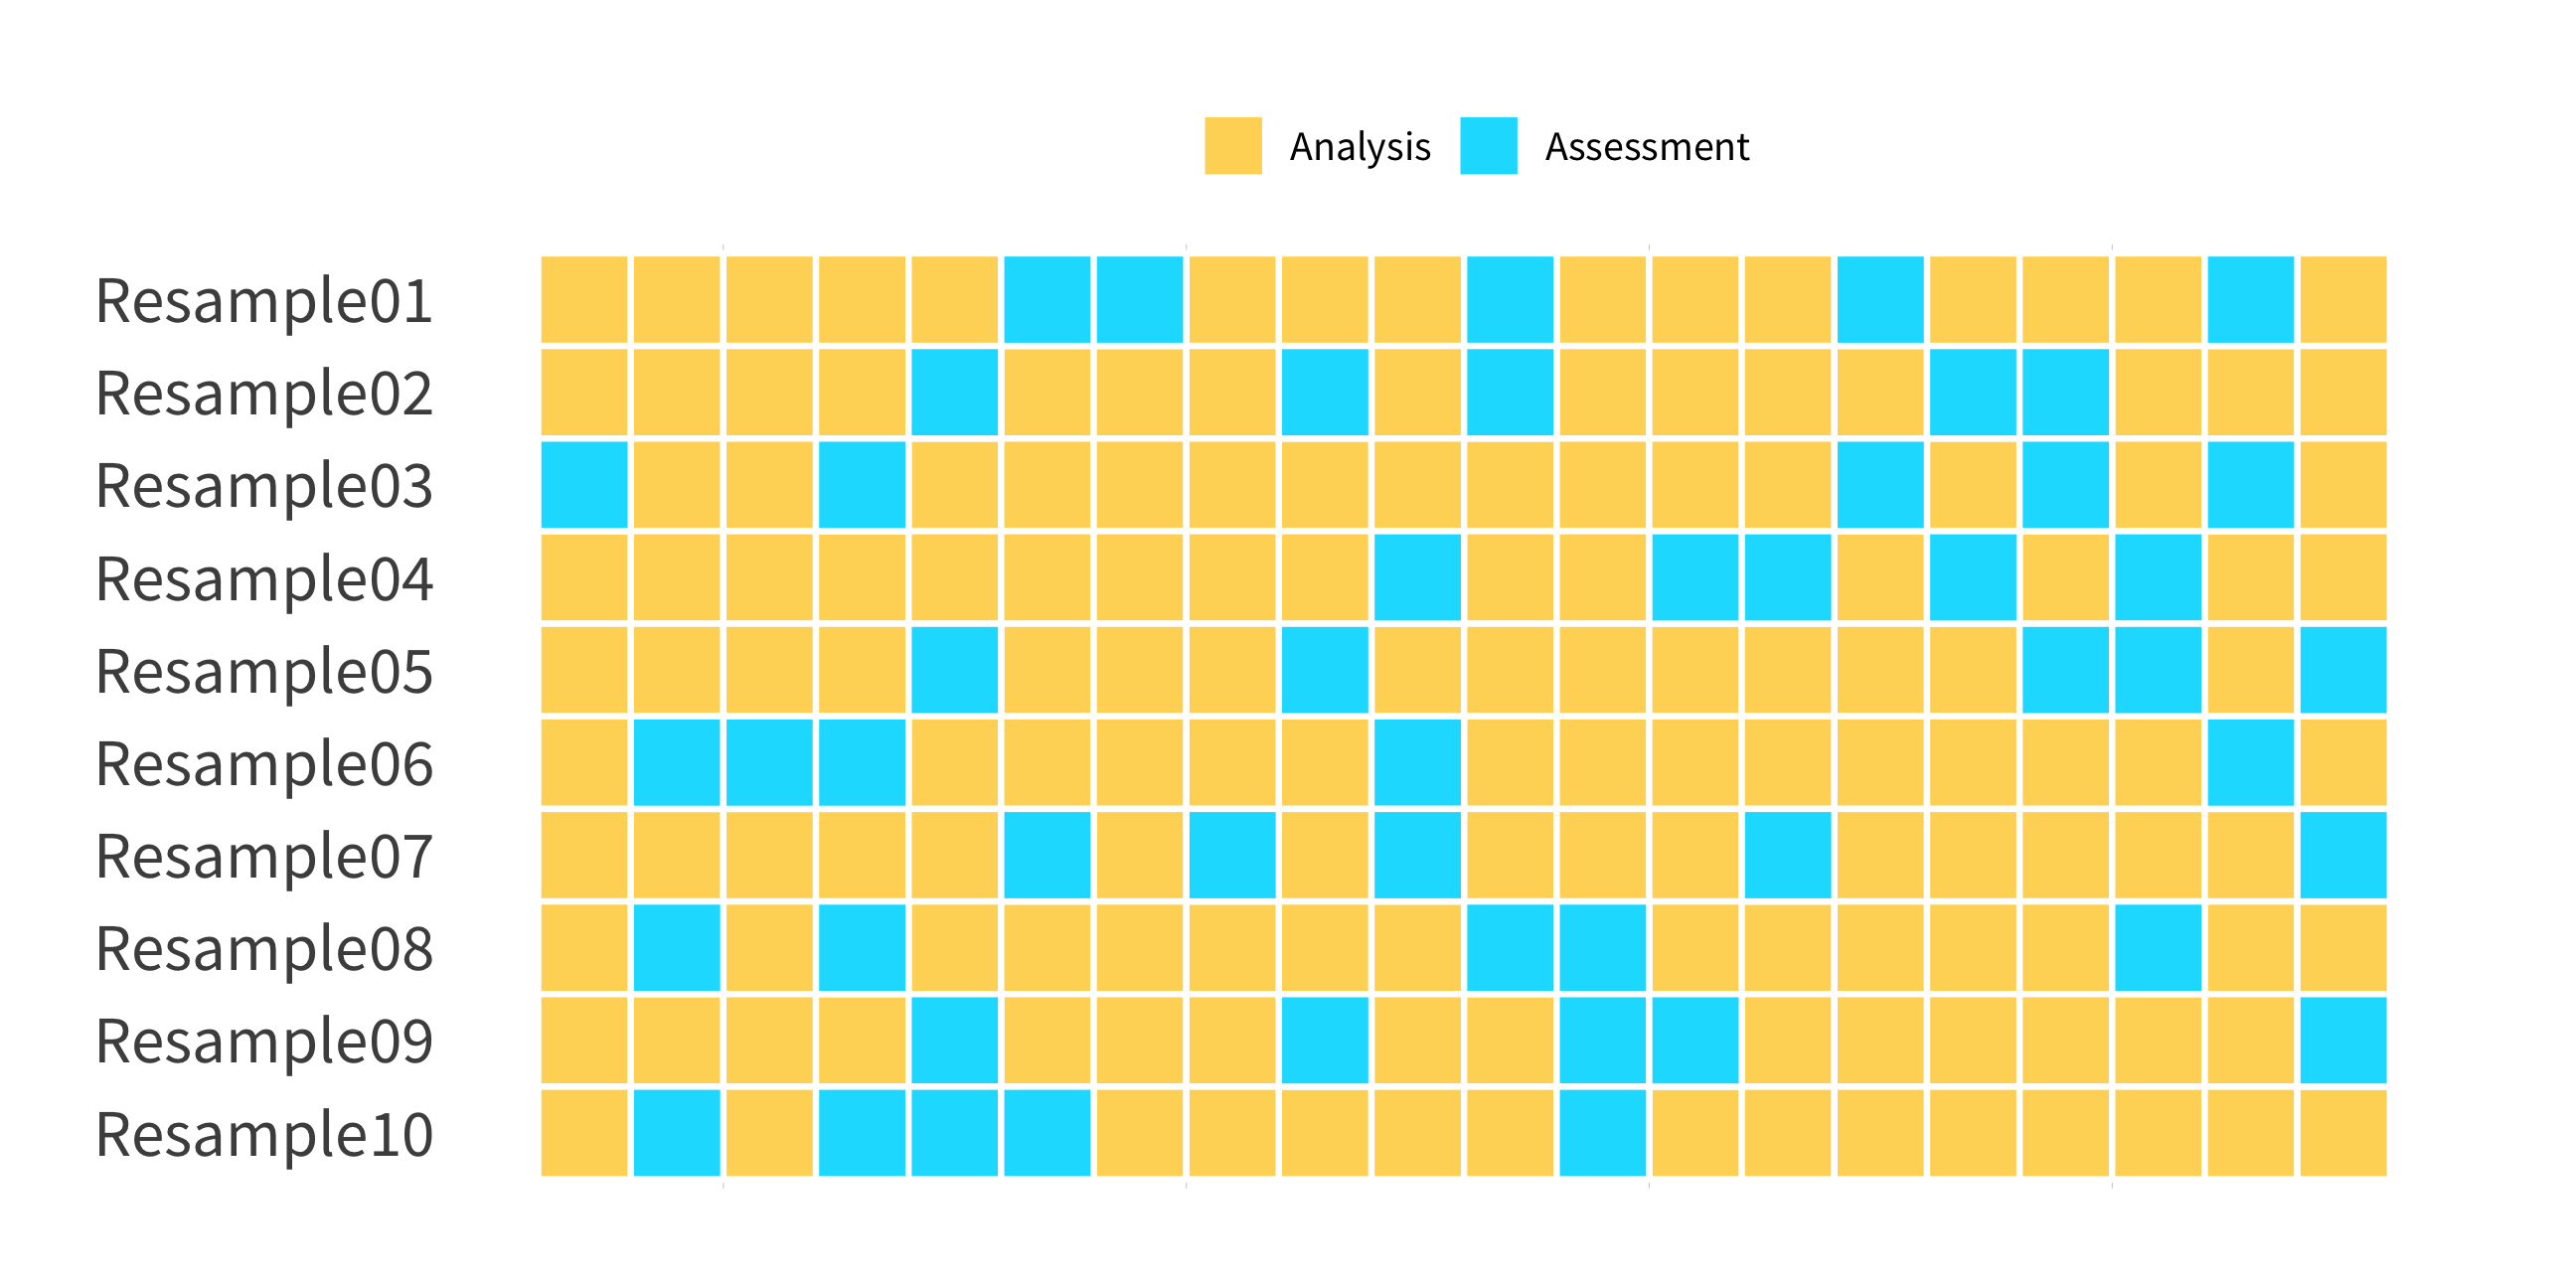
mc_cv() - Monte Carlo (random) CV
(Test sets sampled without replacement)
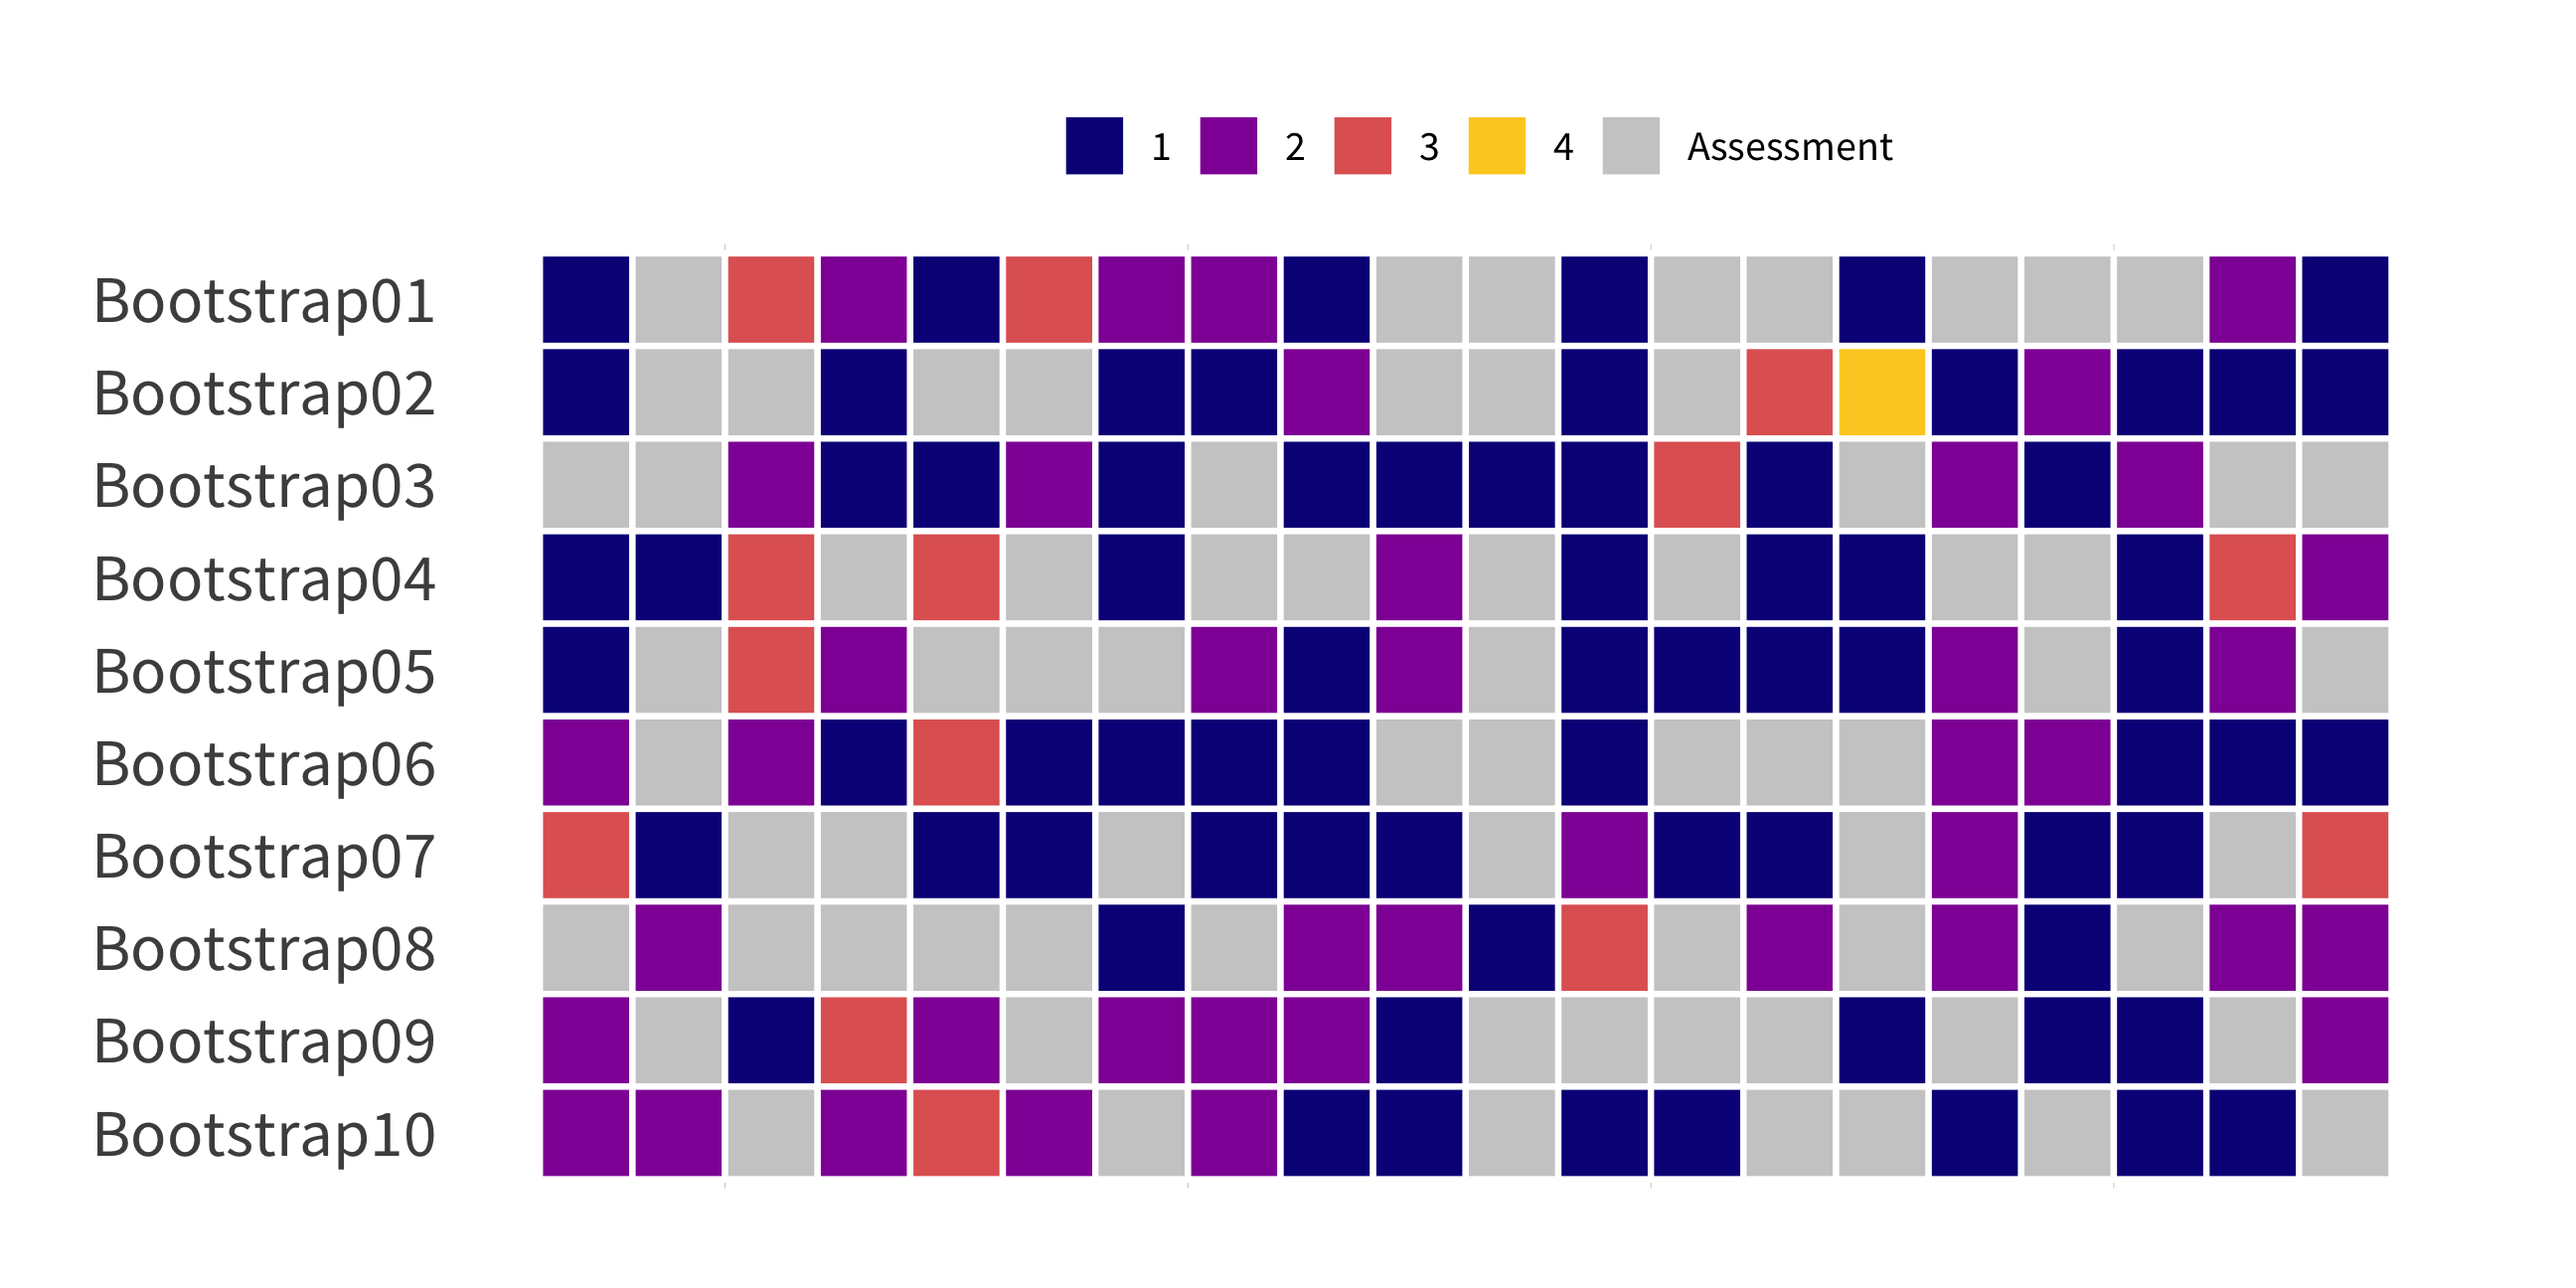
bootstraps()
(Test sets sampled with replacement)
Resampling
Tidy Data Science with the Tidyverse and Tidymodels
W. Jake Thompson
https://tidyds-2021.wjakethompson.com · https://bit.ly/tidyds-2021
Tidy Data Science with the Tidyverse and Tidymodels is licensed under a Creative Commons Attribution 4.0 International License.


