9
Classification
Tidy Data Science with the Tidyverse and Tidymodels
W. Jake Thompson
https://tidyds-2021.wjakethompson.com · https://bit.ly/tidyds-2021
Tidy Data Science with the Tidyverse and Tidymodels is licensed under a Creative Commons Attribution 4.0 International License.
Your Turn 0
- Open the R Notebook materials/exercises/09-classification.Rmd
- Run the setup chunk
01:00
Goal of Machine Learning
Goal of Machine Learning
🔨 construct models that
Goal of Machine Learning
🔨 construct models that
🎯 generate accurate predictions
Goal of Machine Learning
🔨 construct models that
🎯 generate accurate predictions
🆕 for future, yet-to-be-seen data
Goal of Machine Learning
🔨 construct models that
🎯 generate accurate predictions
🆕 for future, yet-to-be-seen data
Max Kuhn & Kjell Johnston, http://www.feat.engineering/
A model doesn't have to be a straight line...
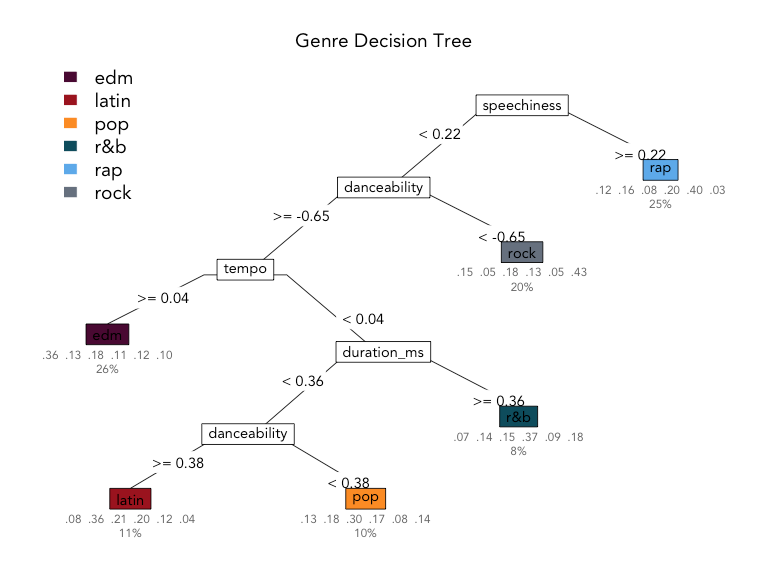
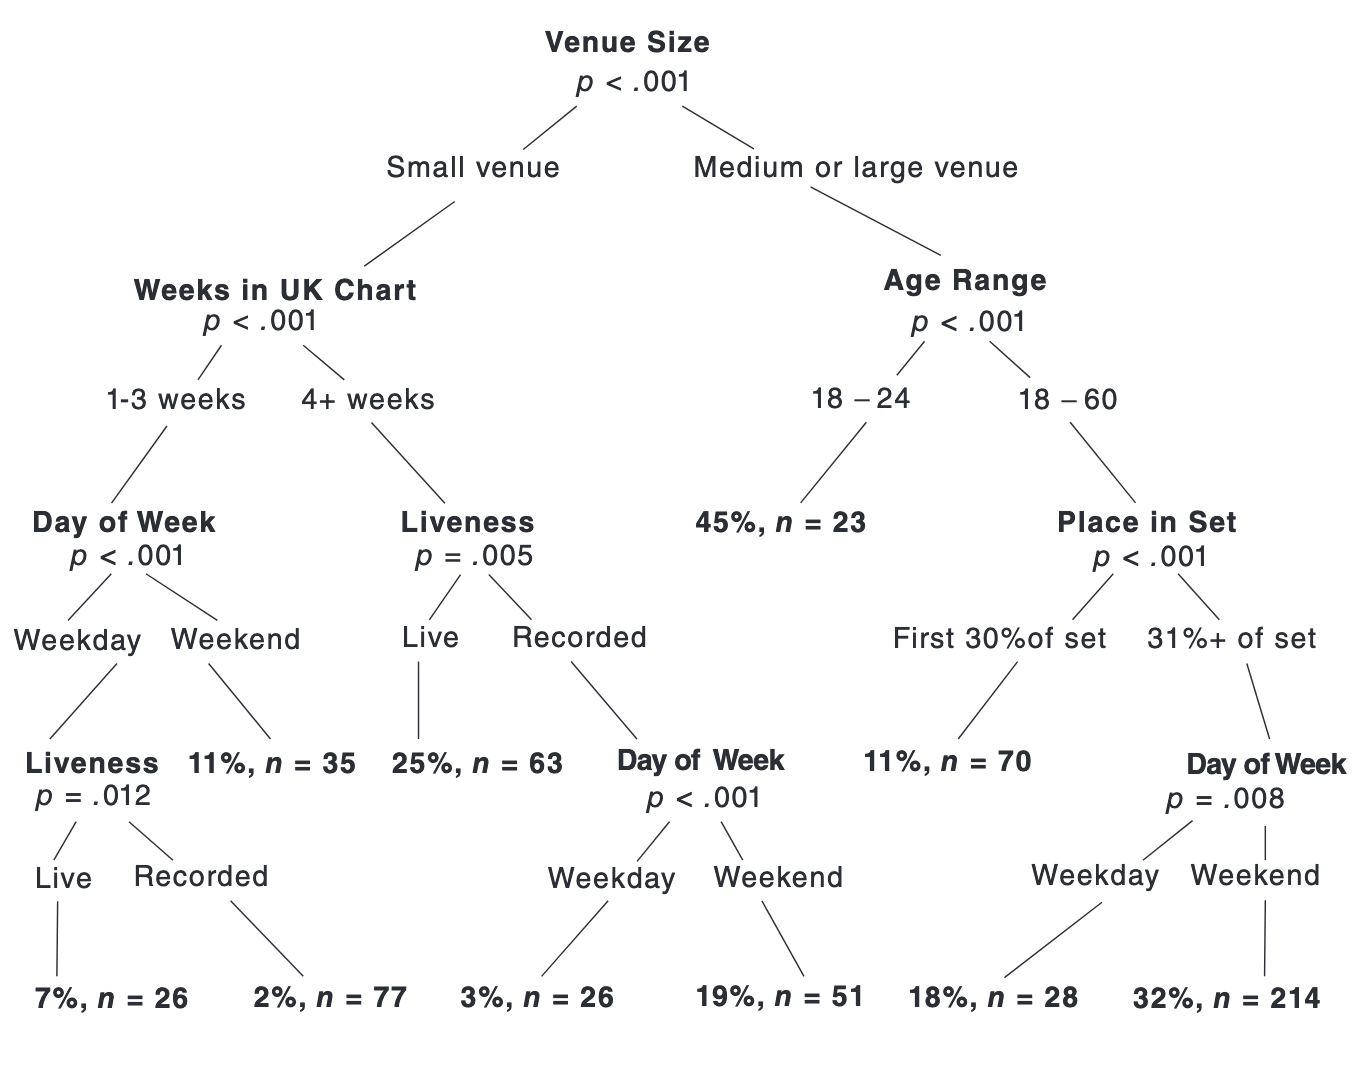
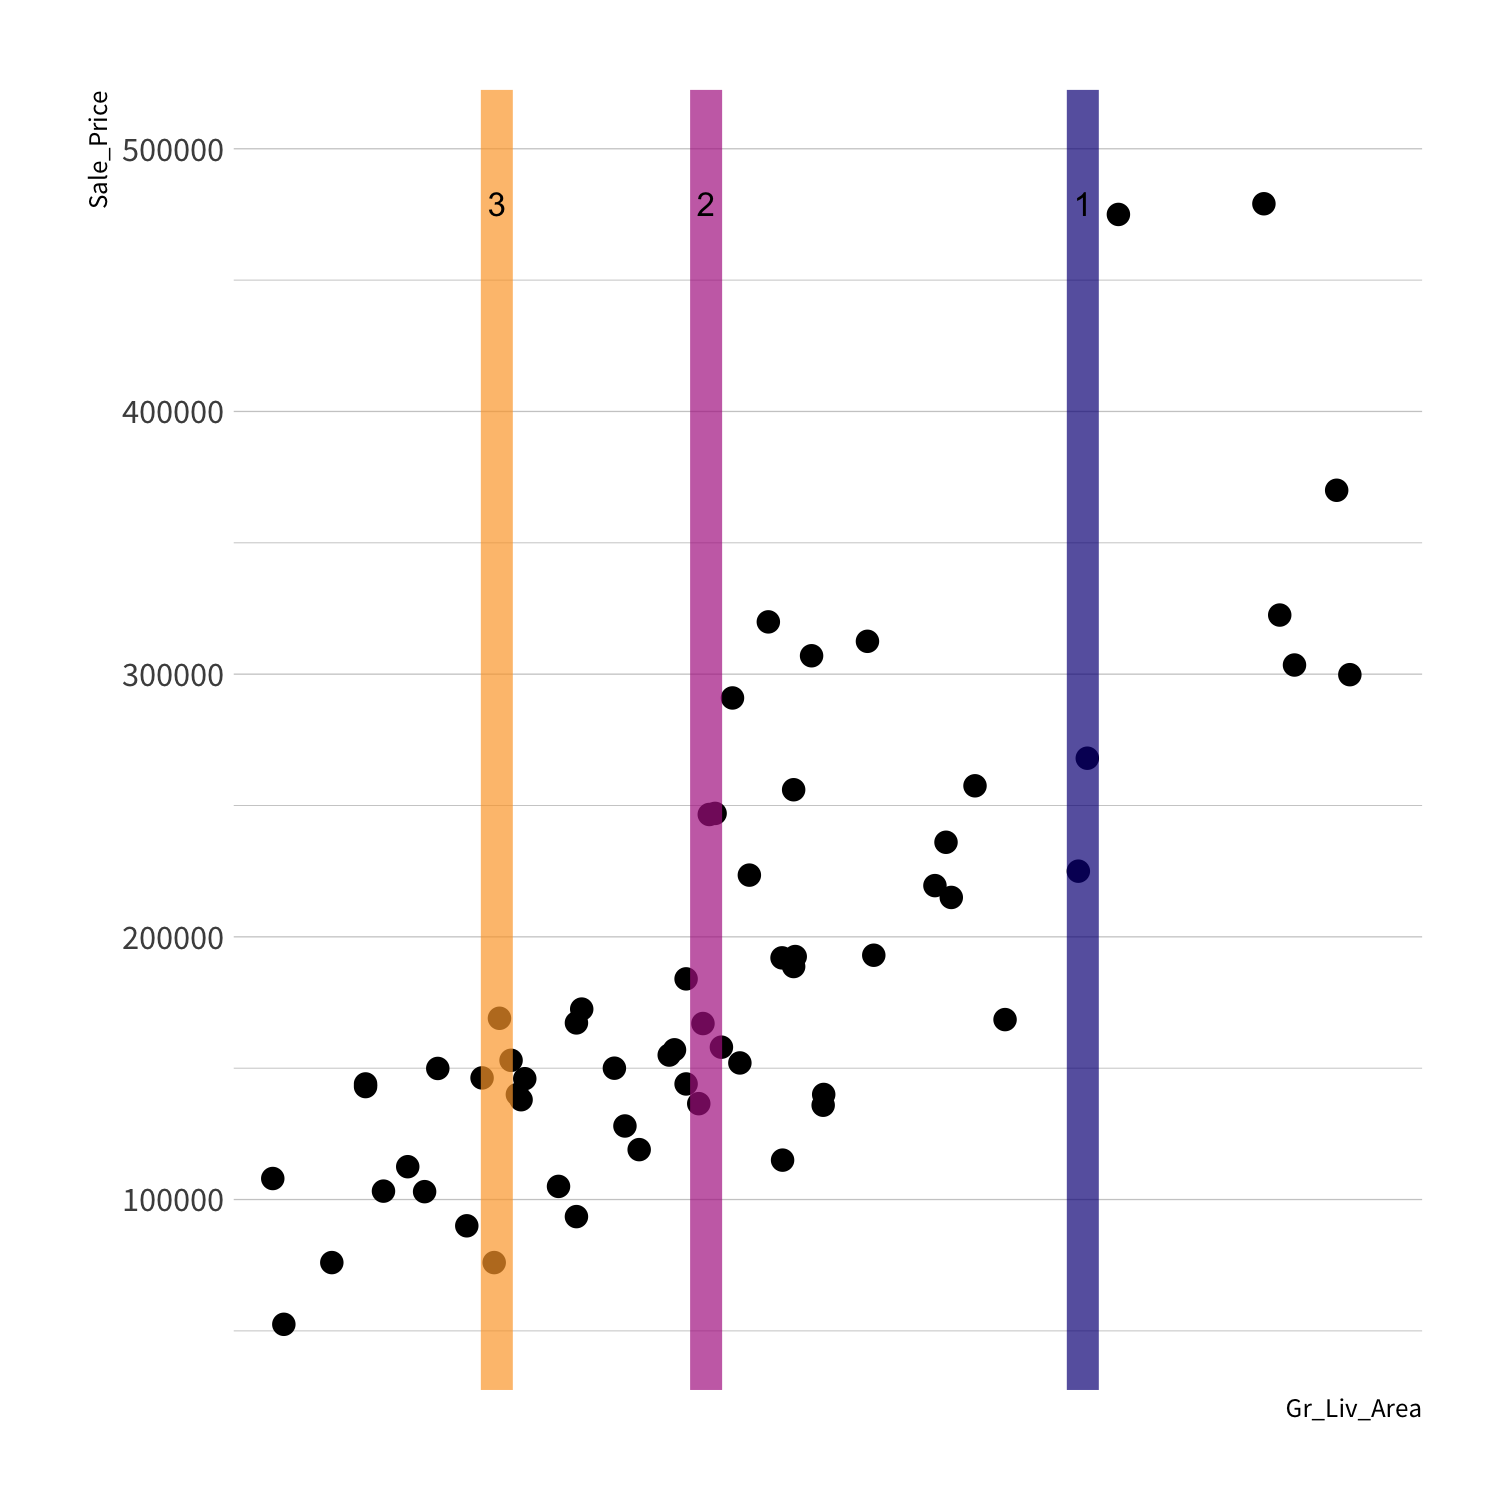
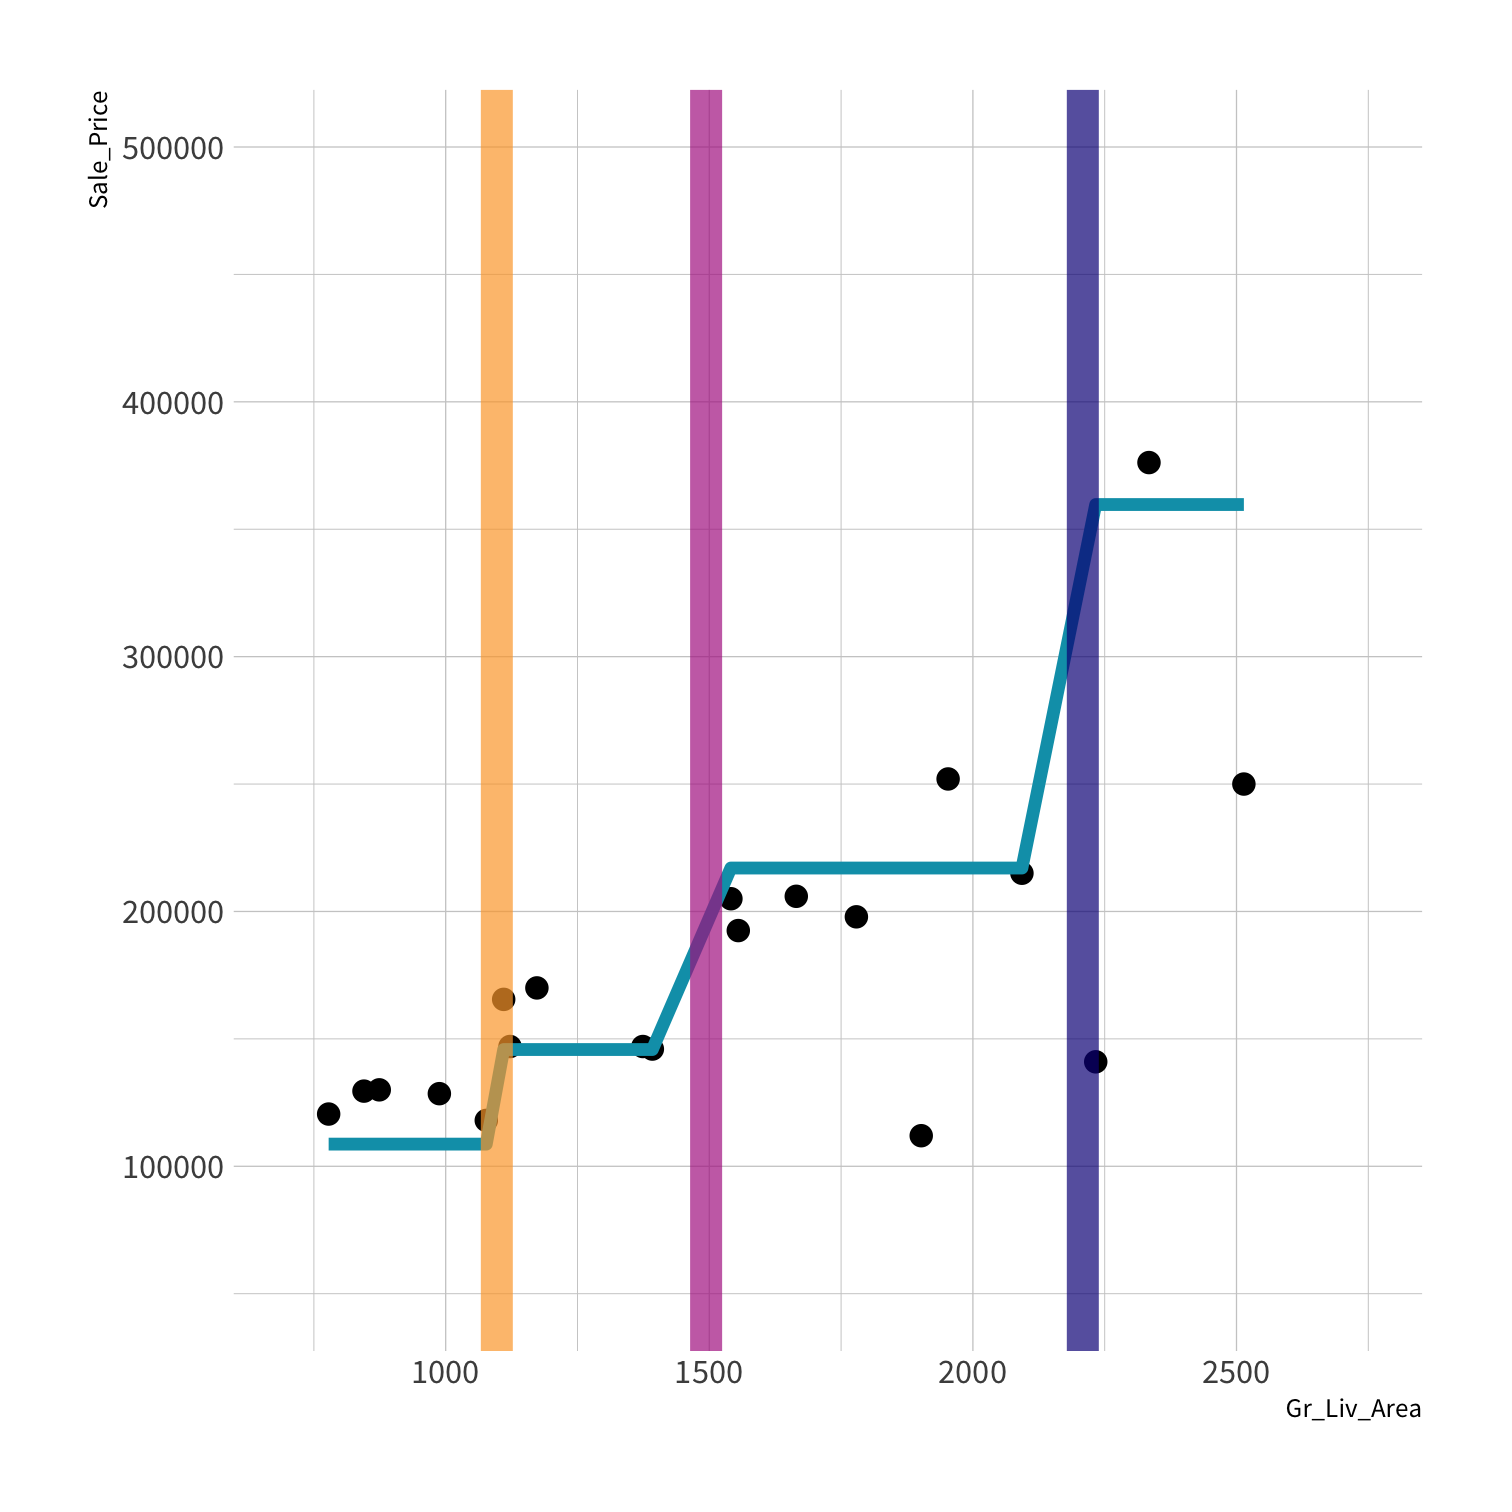
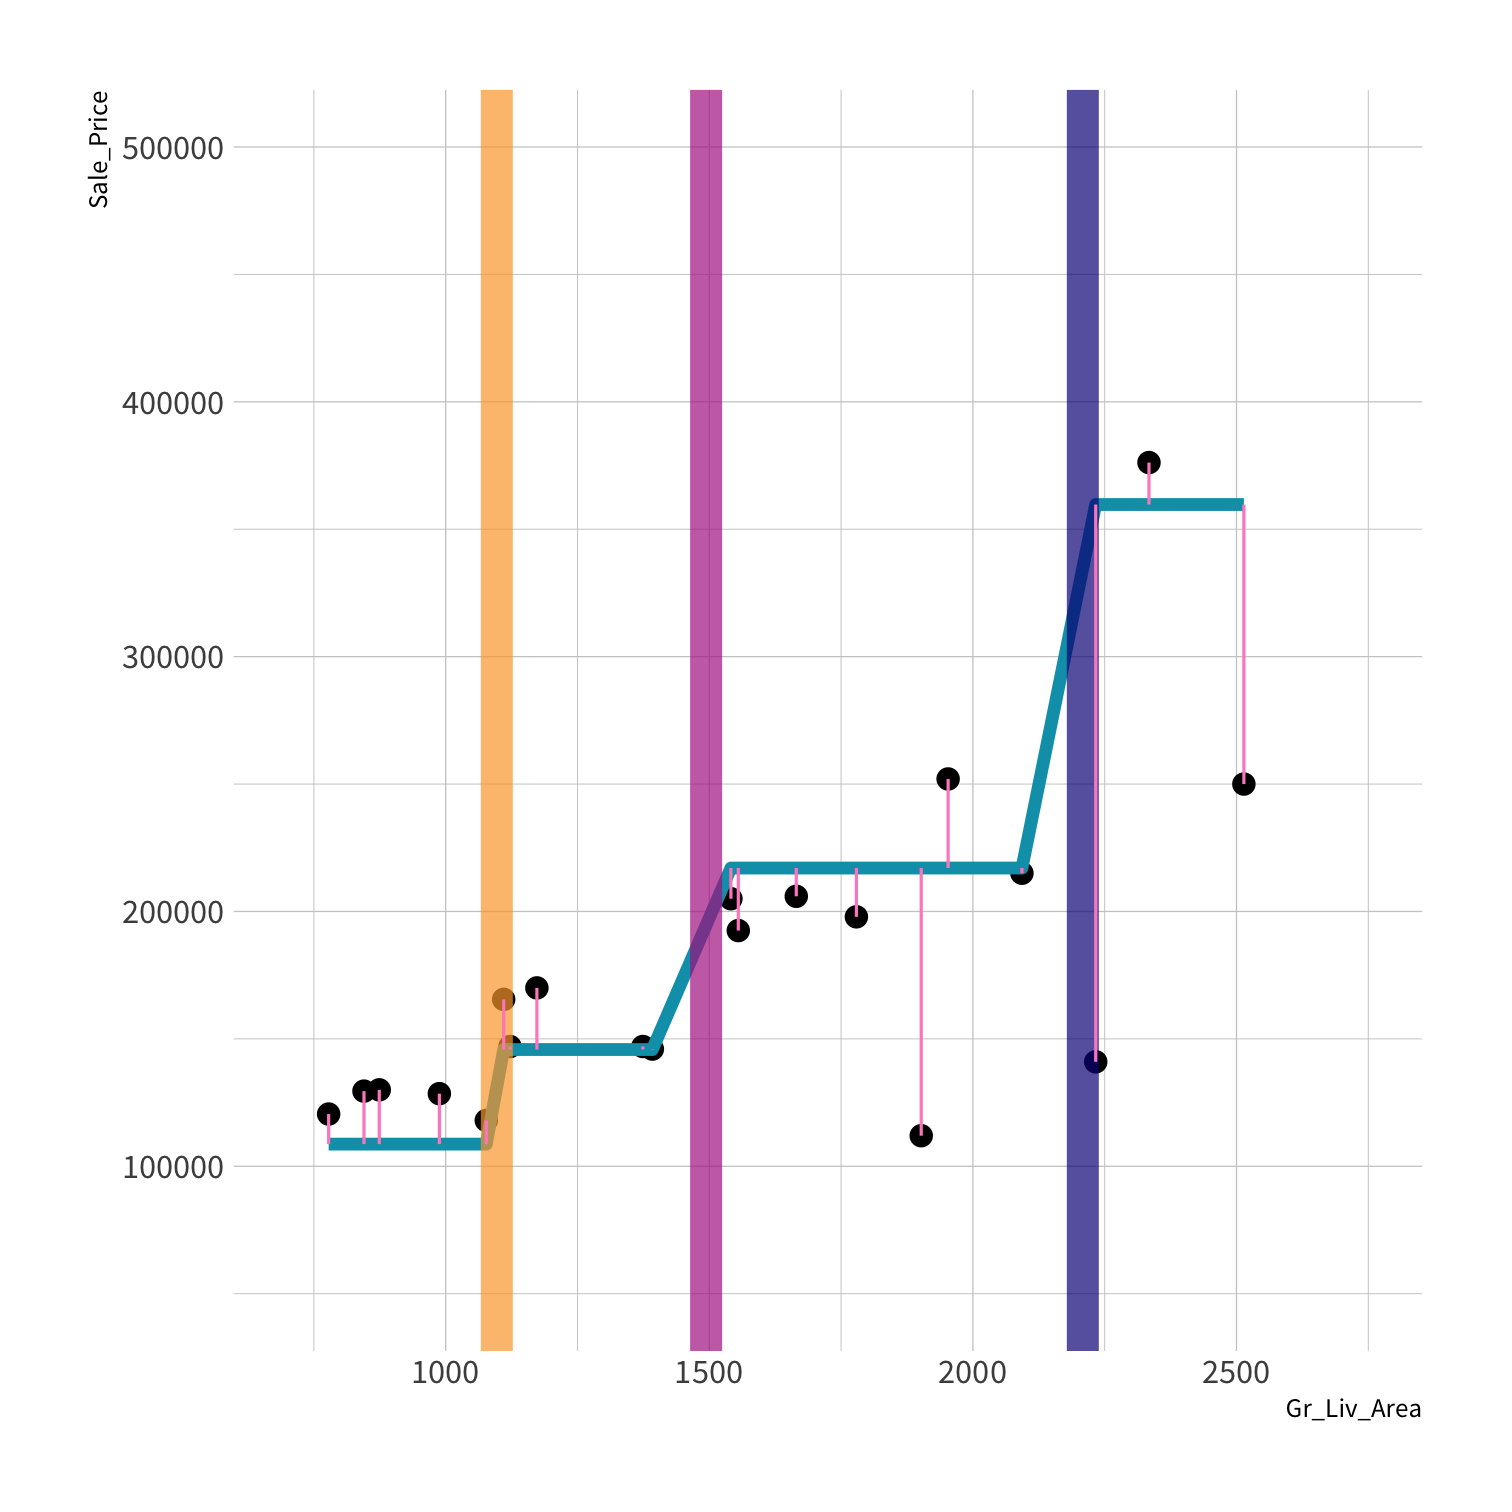
Decision Trees
To predict the outcome of a new data point:
Use rules learned from splits
Each split maximizes information gain

Consider
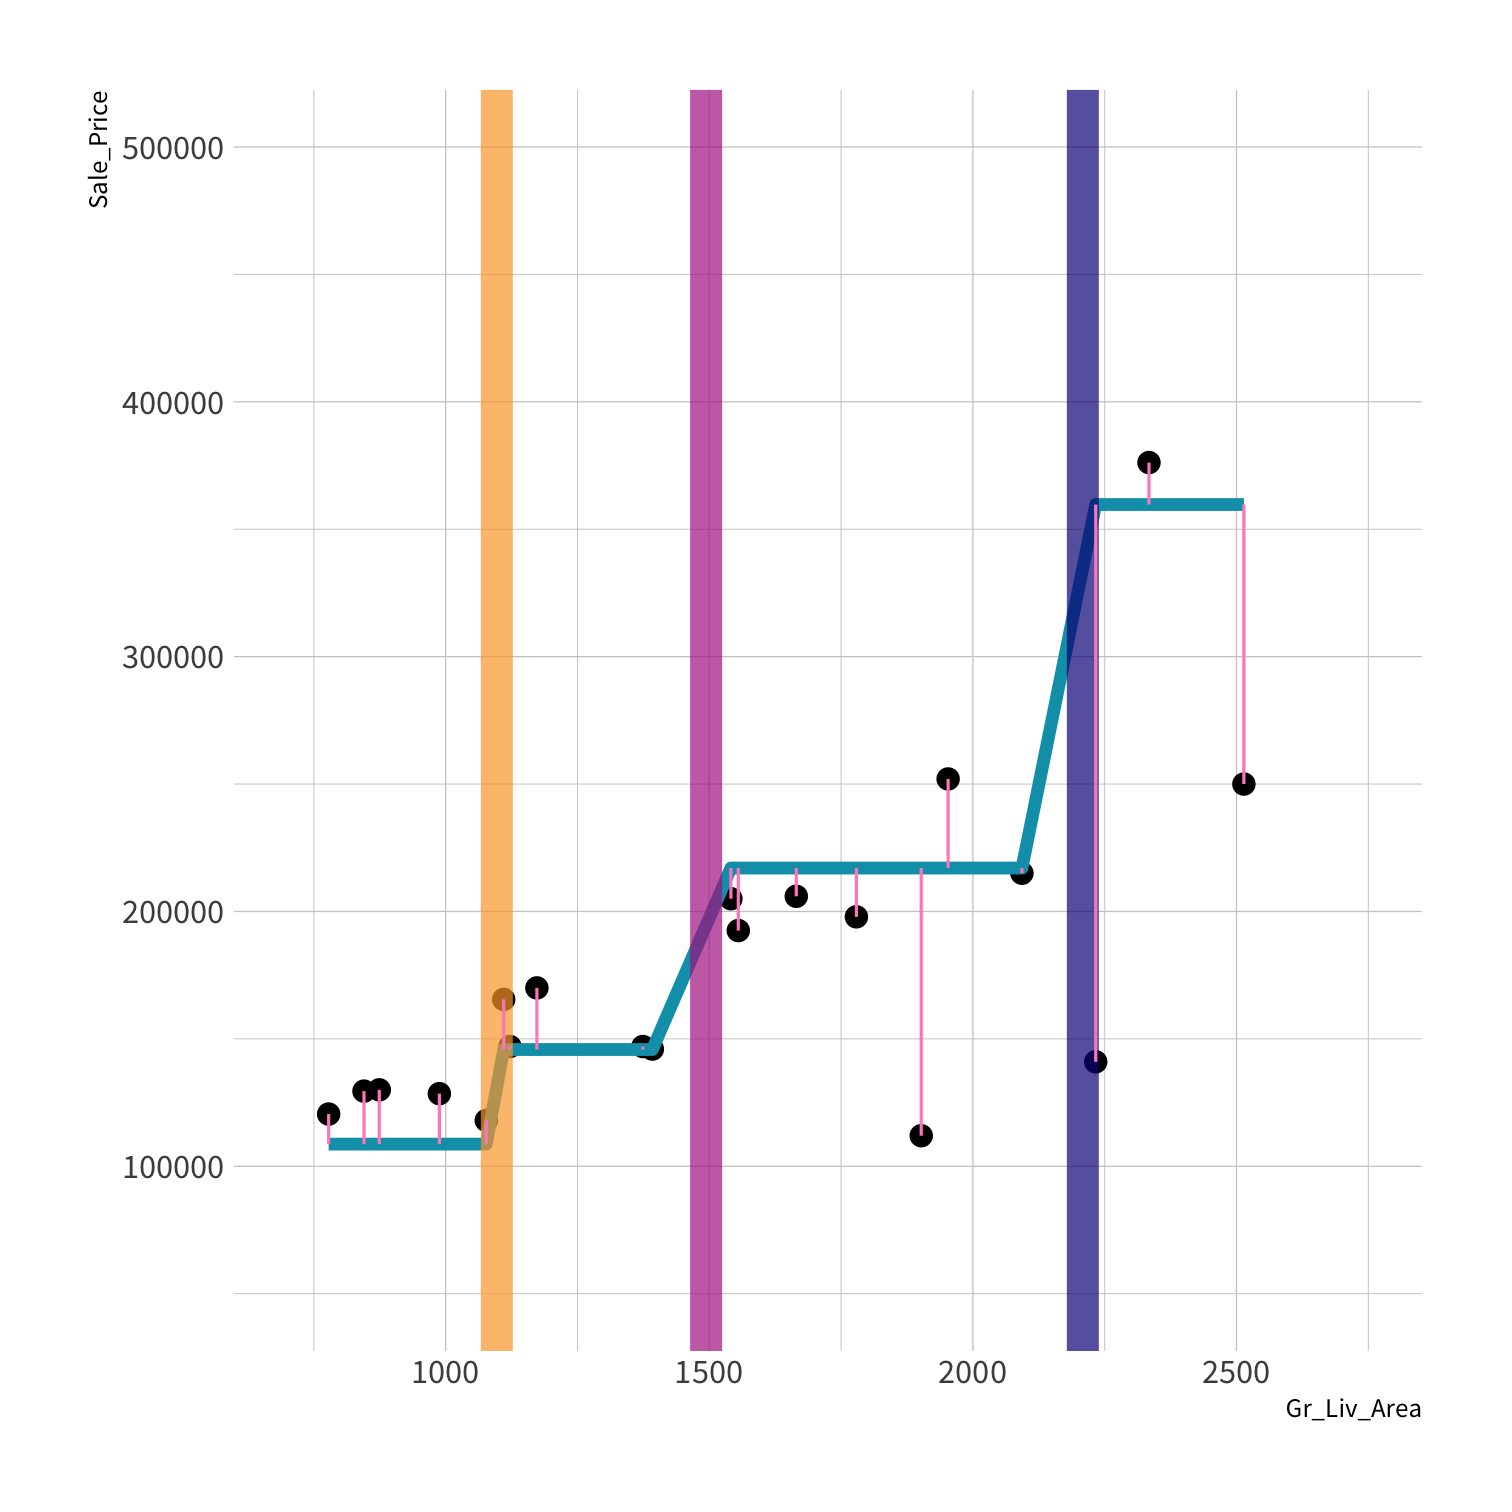
How do we assess predictions here?
Consider
How do we assess predictions here?
RMSE?
LM RMSE = 53884.78
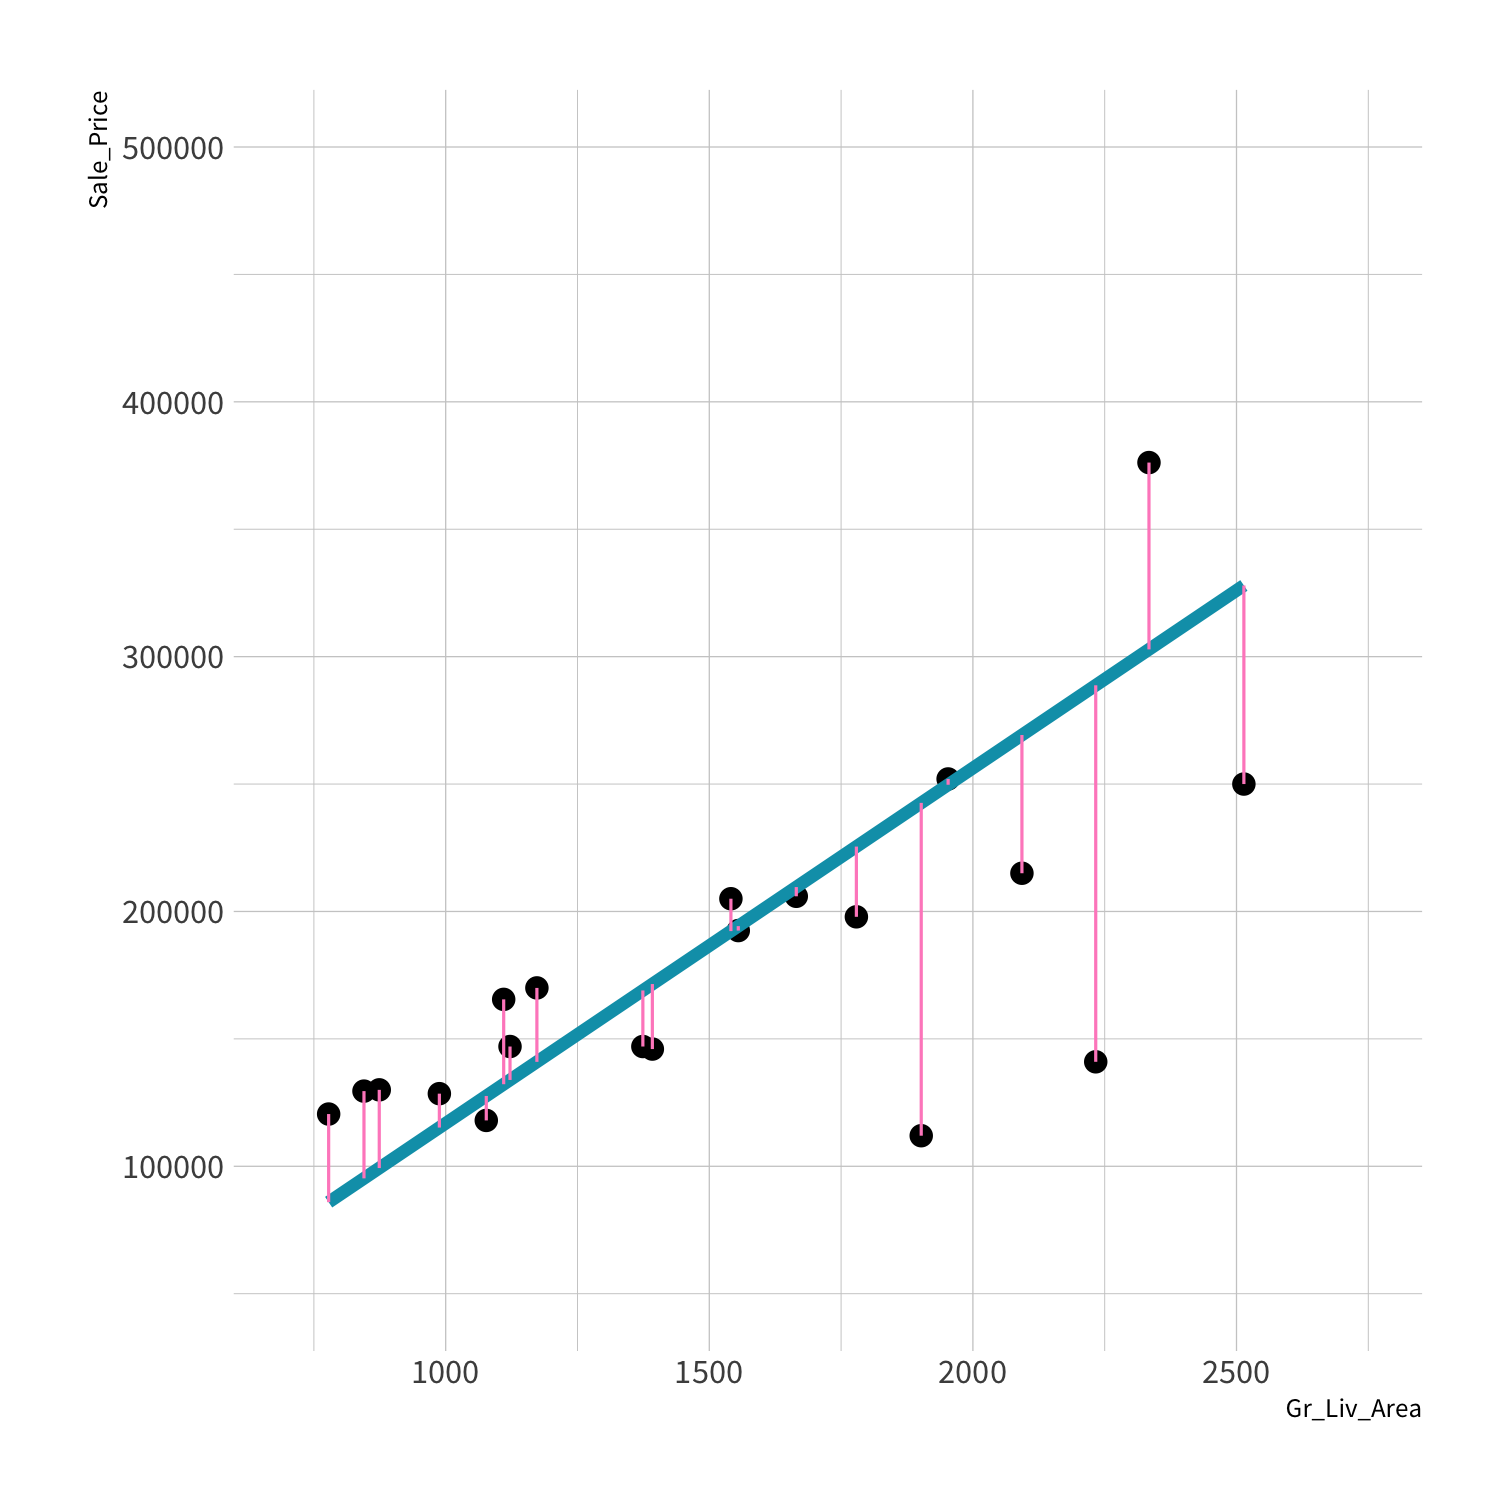
LM RMSE = 53884.78

Tree RMSE = 61687.24
What is a model?
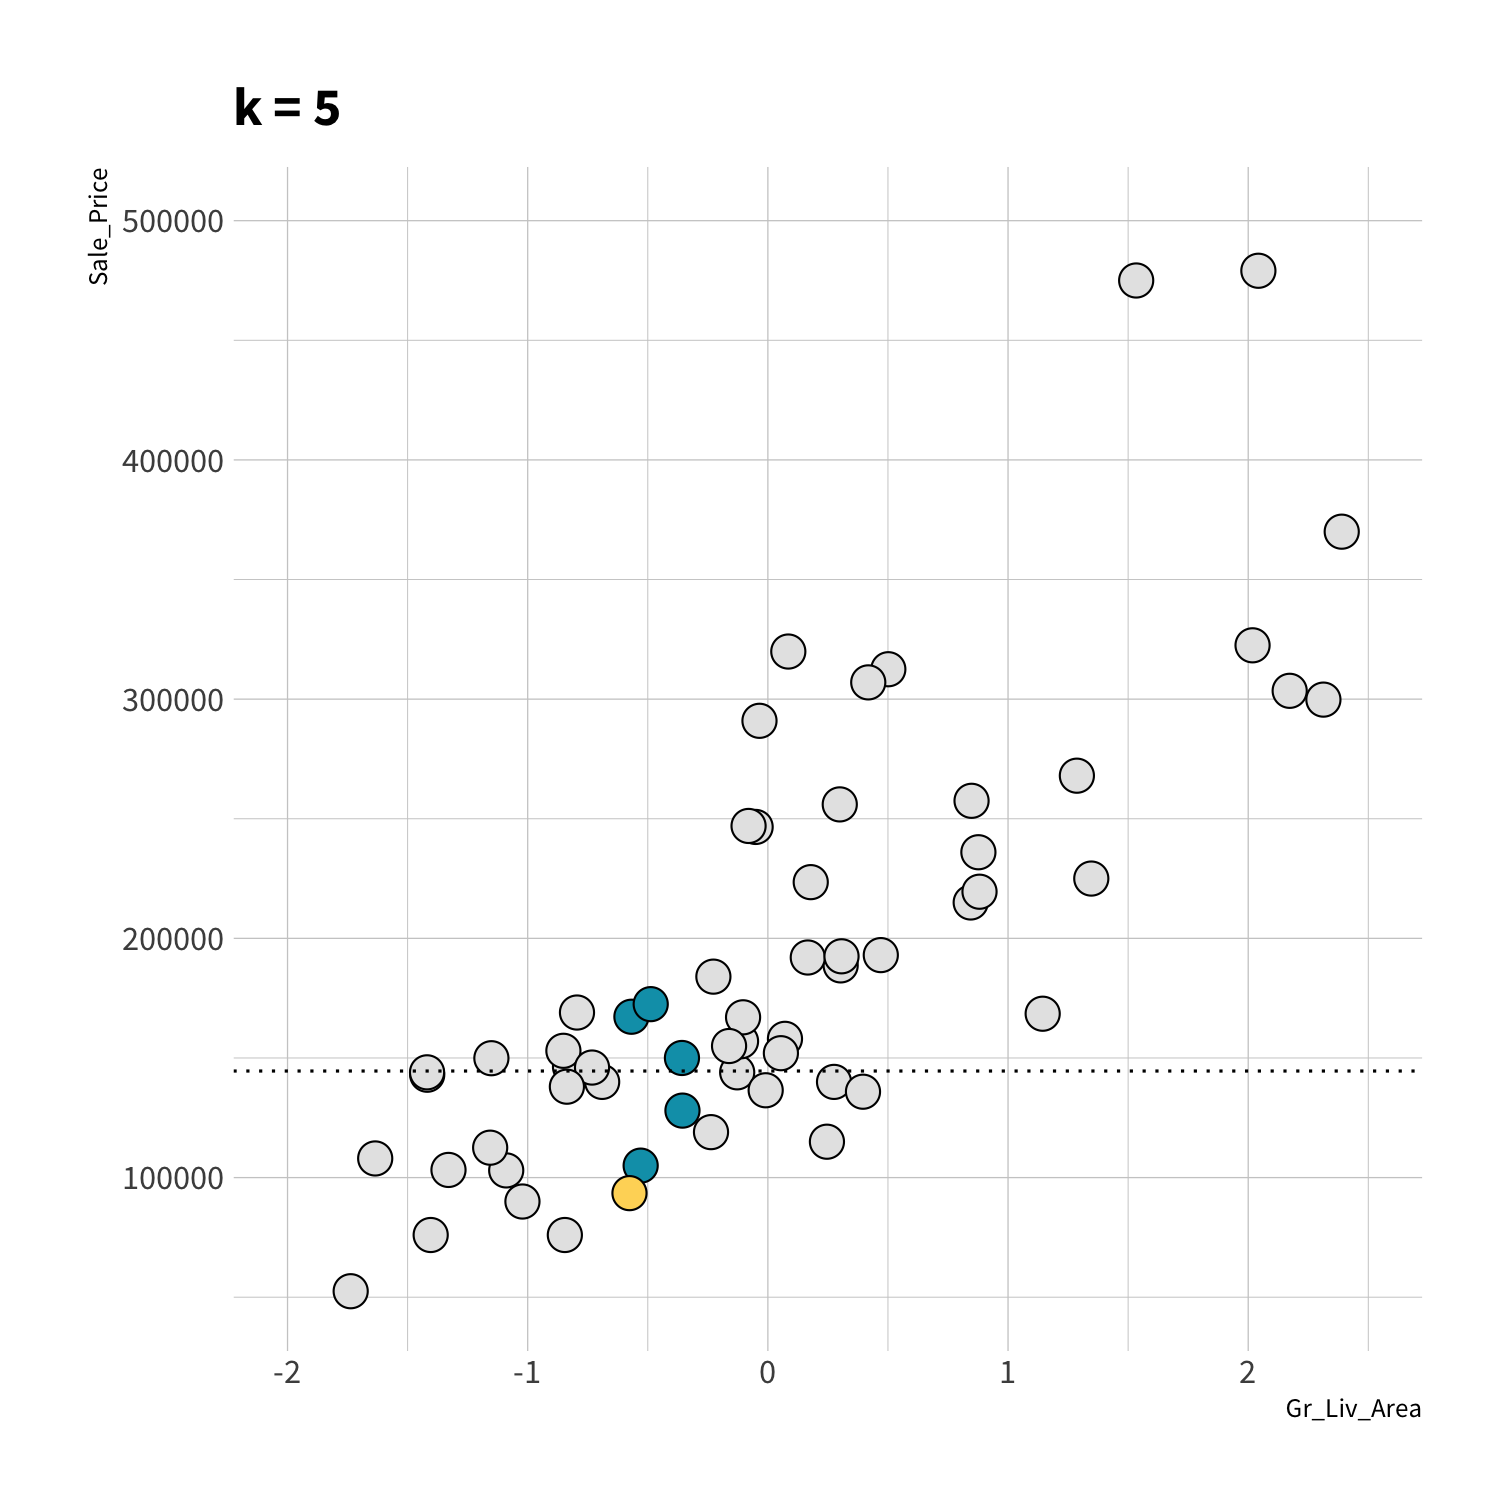
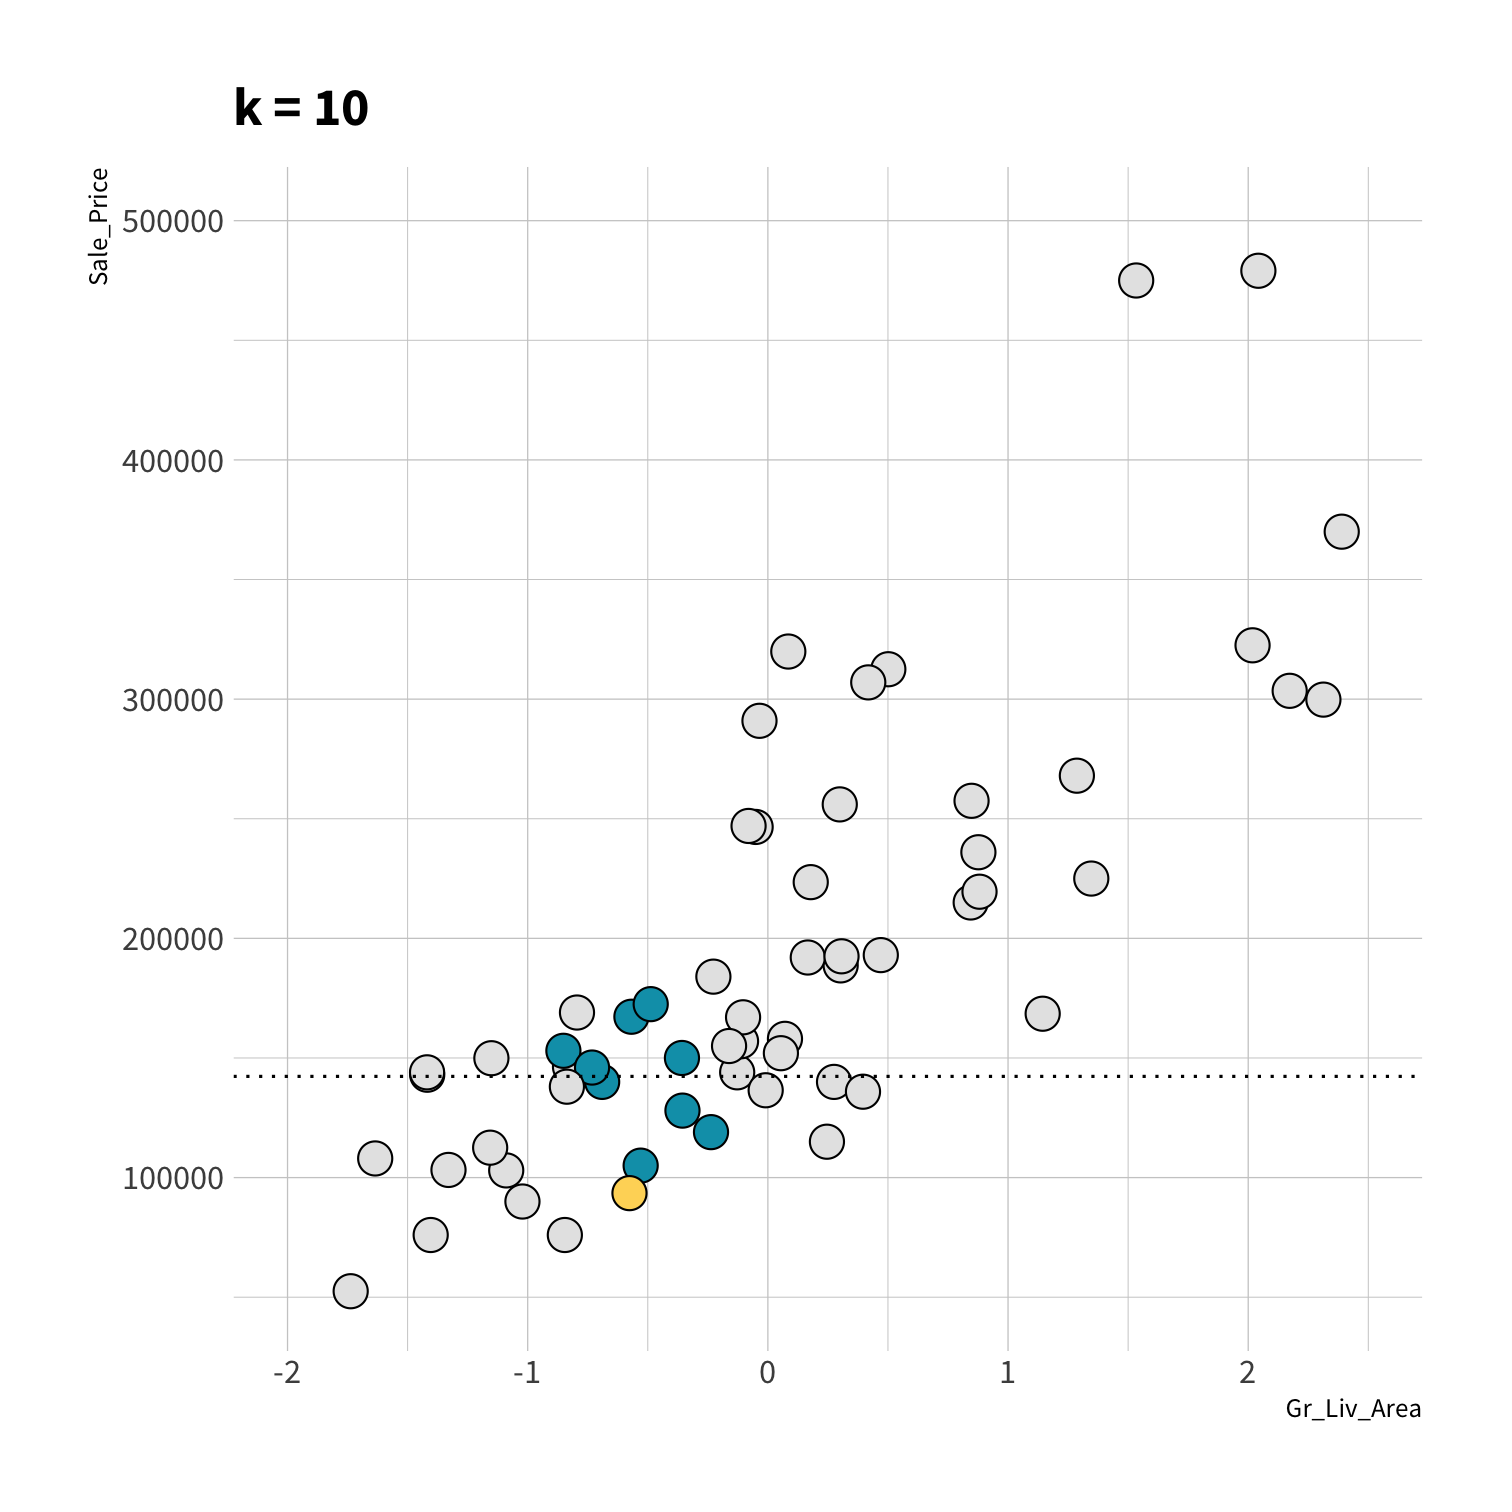
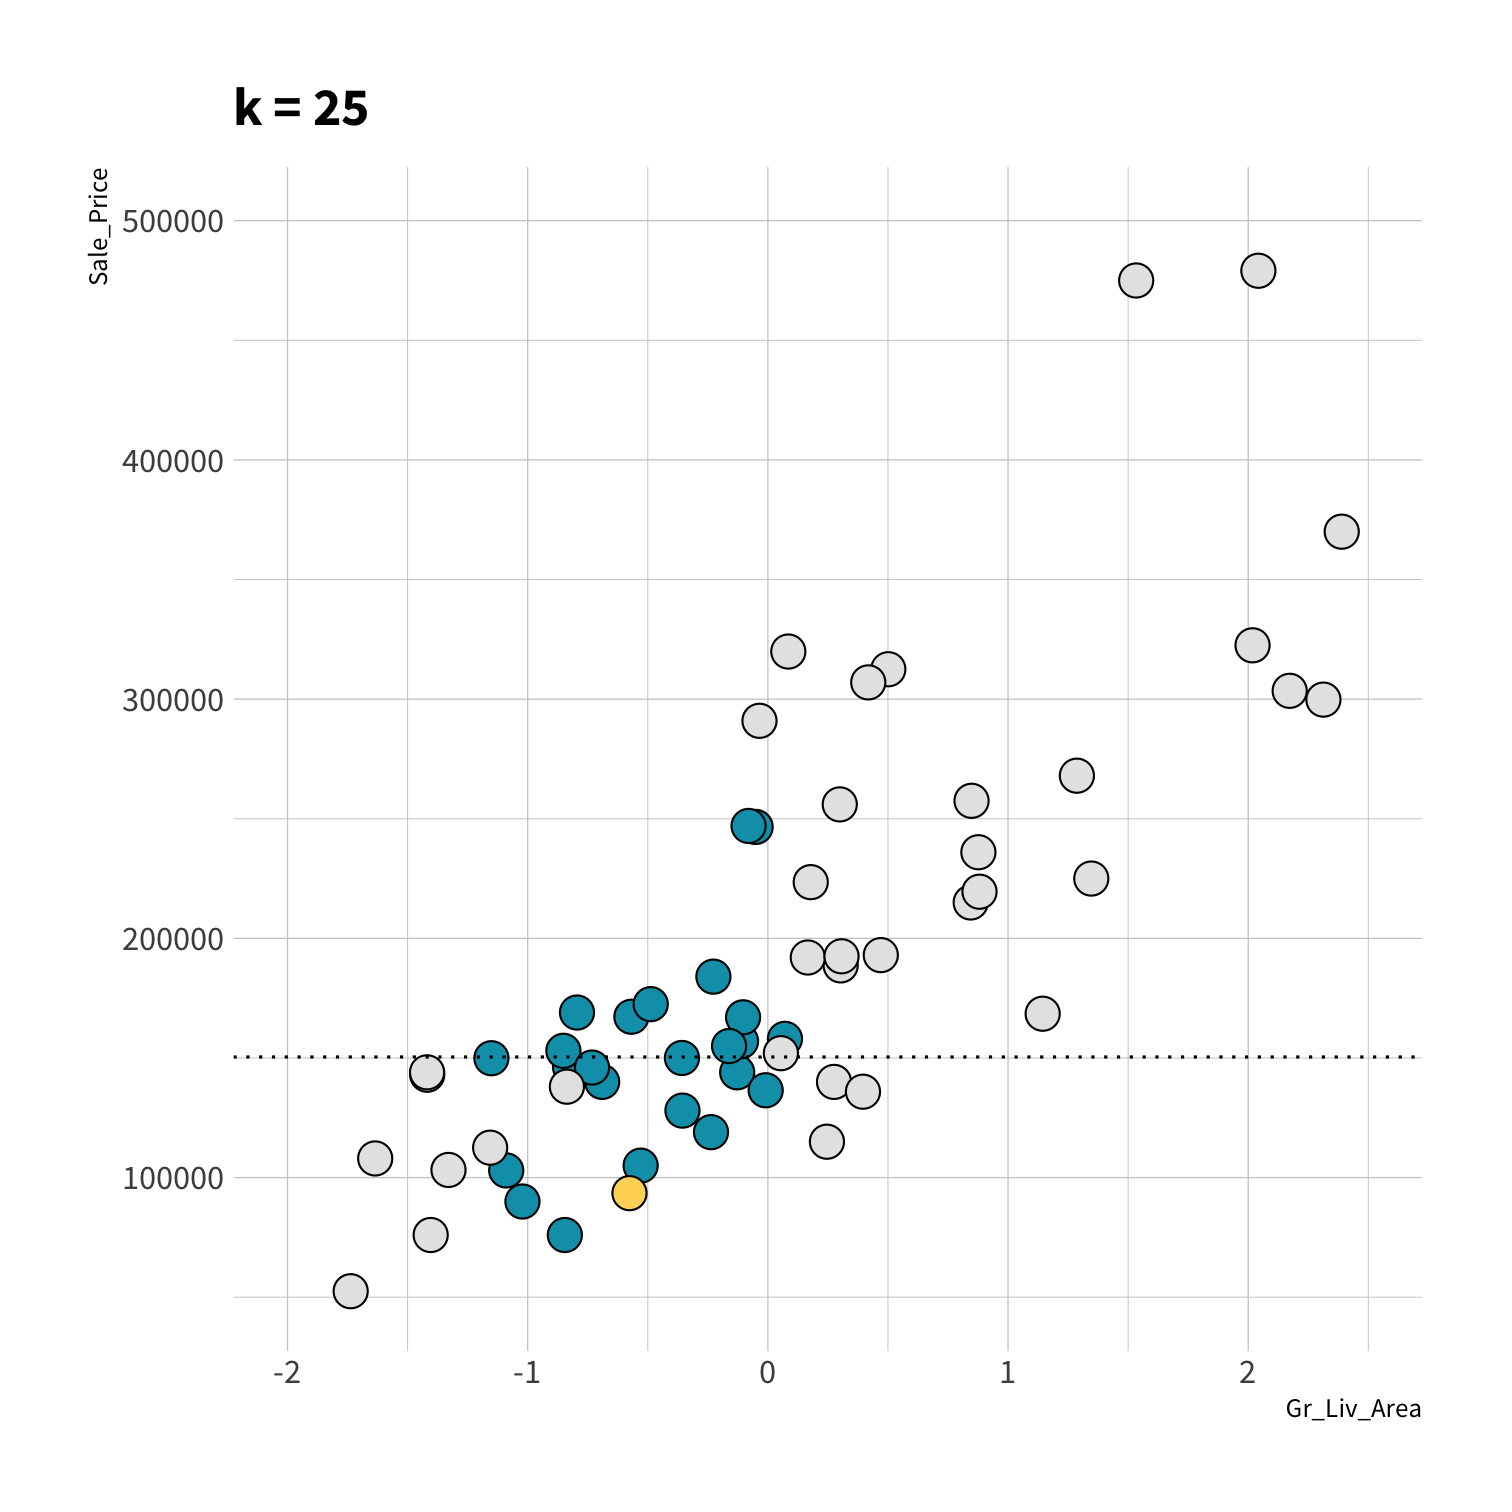
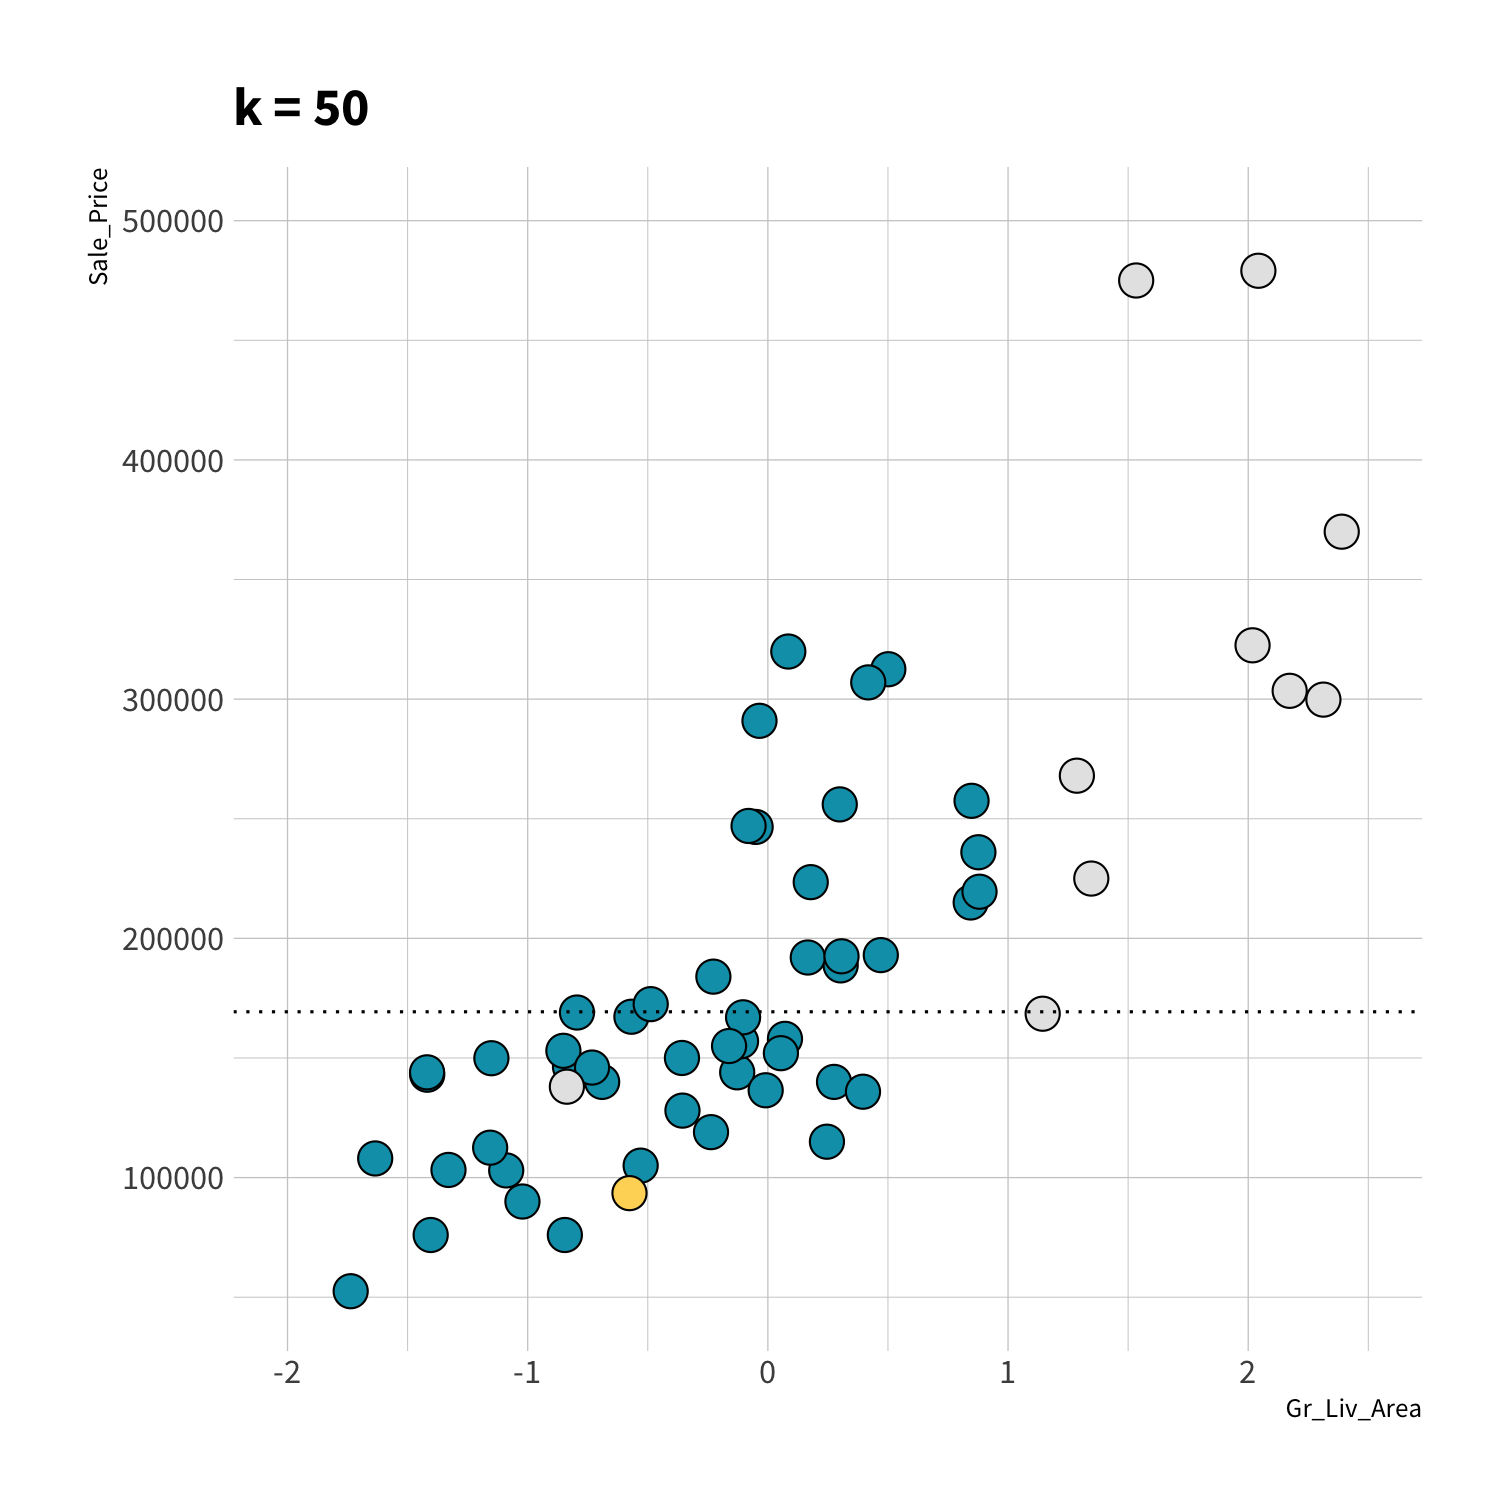
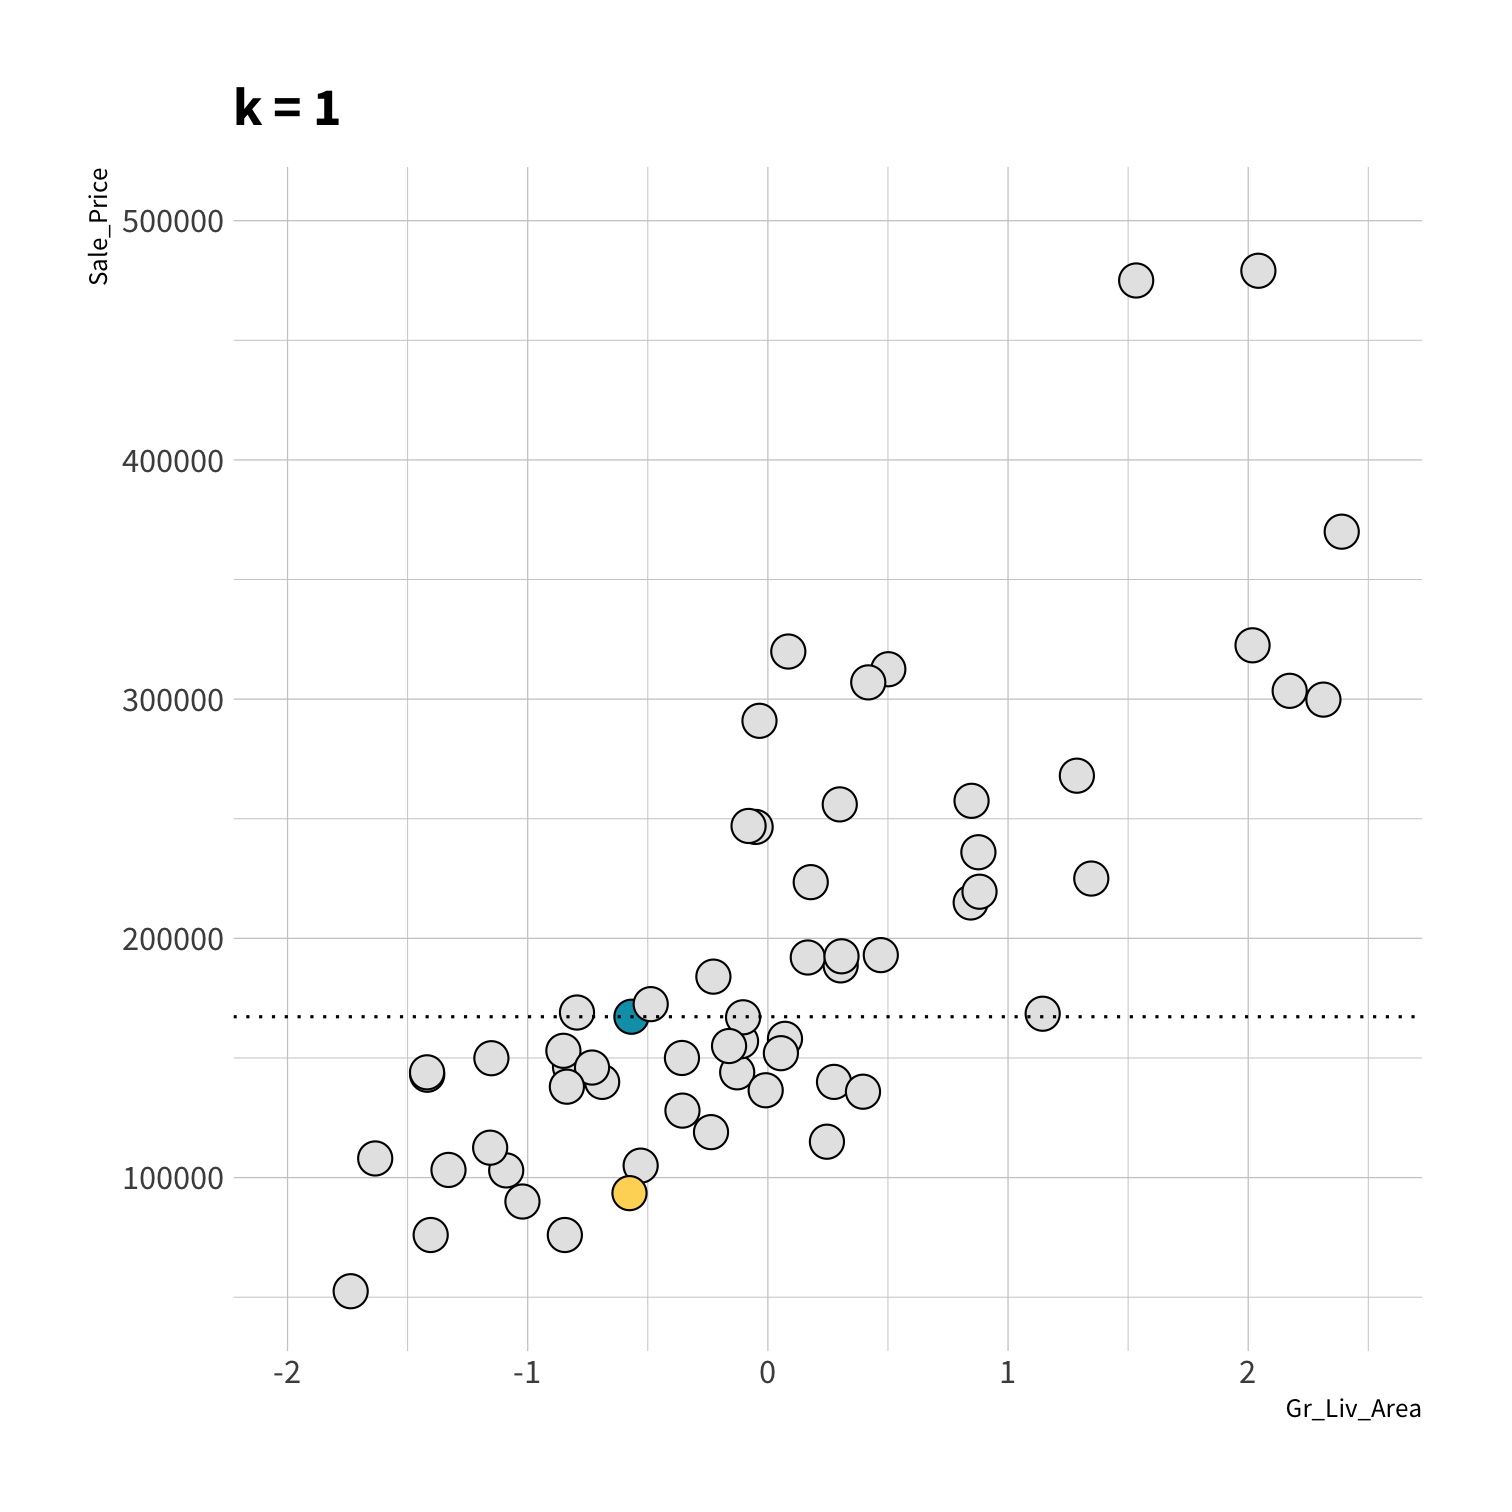
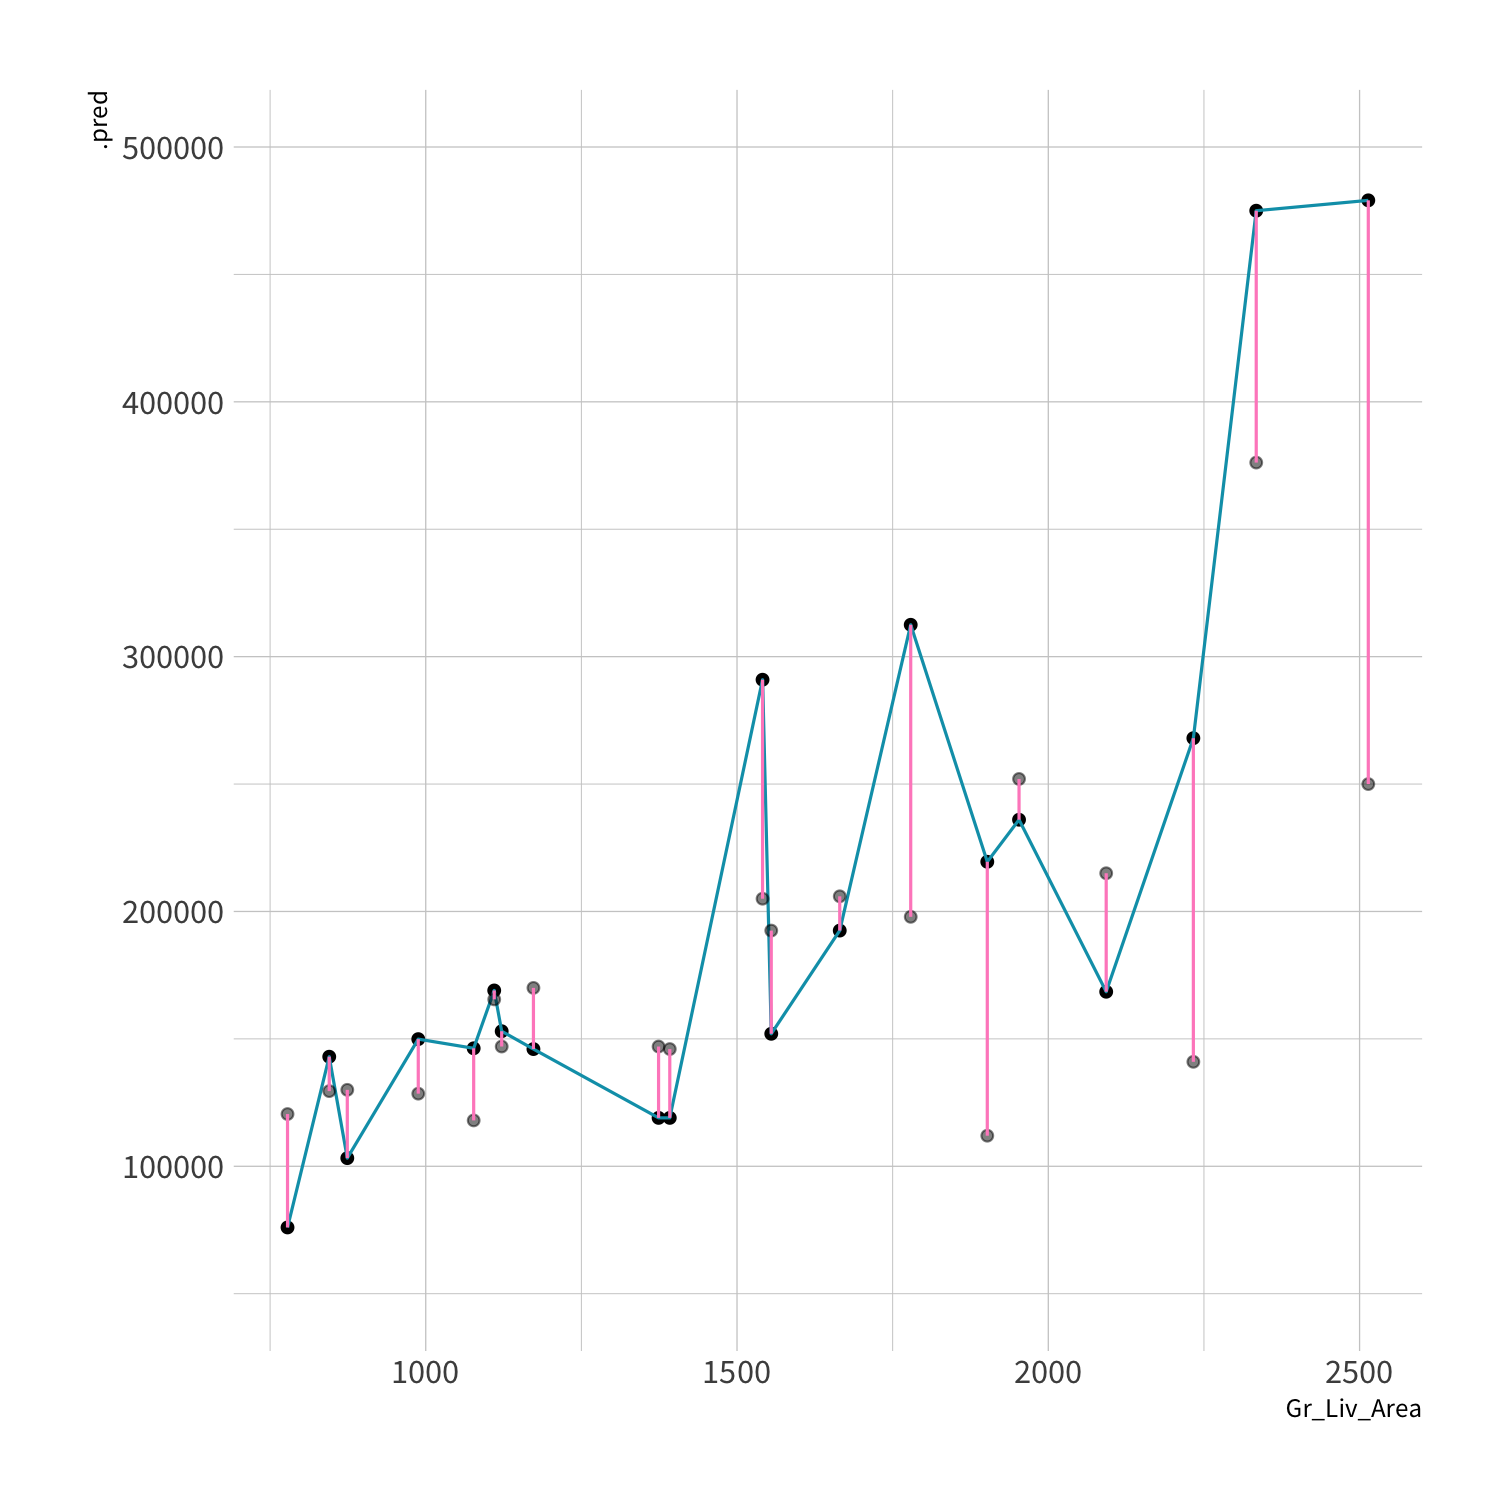
K Nearest Neighbors (KNN)
To predict the outcome of a new data point:
Find the K most similar old data points
Take the average/mode/etc. outcome
library(kknn)knn_spec <- nearest_neighbor(neighbors = 5) %>% set_engine("kknn") %>% set_mode("regression")set.seed(100)knn_fit <- fit(knn_spec, Sale_Price ~ ., data = ames_train)knn_pred <- knn_fit %>% predict(new_data = ames_test) %>% mutate(price_truth = ames_test$Sale_Price)rmse(knn_pred, truth = price_truth, estimate = .pred)#> # A tibble: 1 x 3#> .metric .estimator .estimate#> <chr> <chr> <dbl>#> 1 rmse standard 35870.rsq(knn_pred, truth = price_truth, estimate = .pred)#> # A tibble: 1 x 3#> .metric .estimator .estimate#> <chr> <chr> <dbl>#> 1 rsq standard 0.812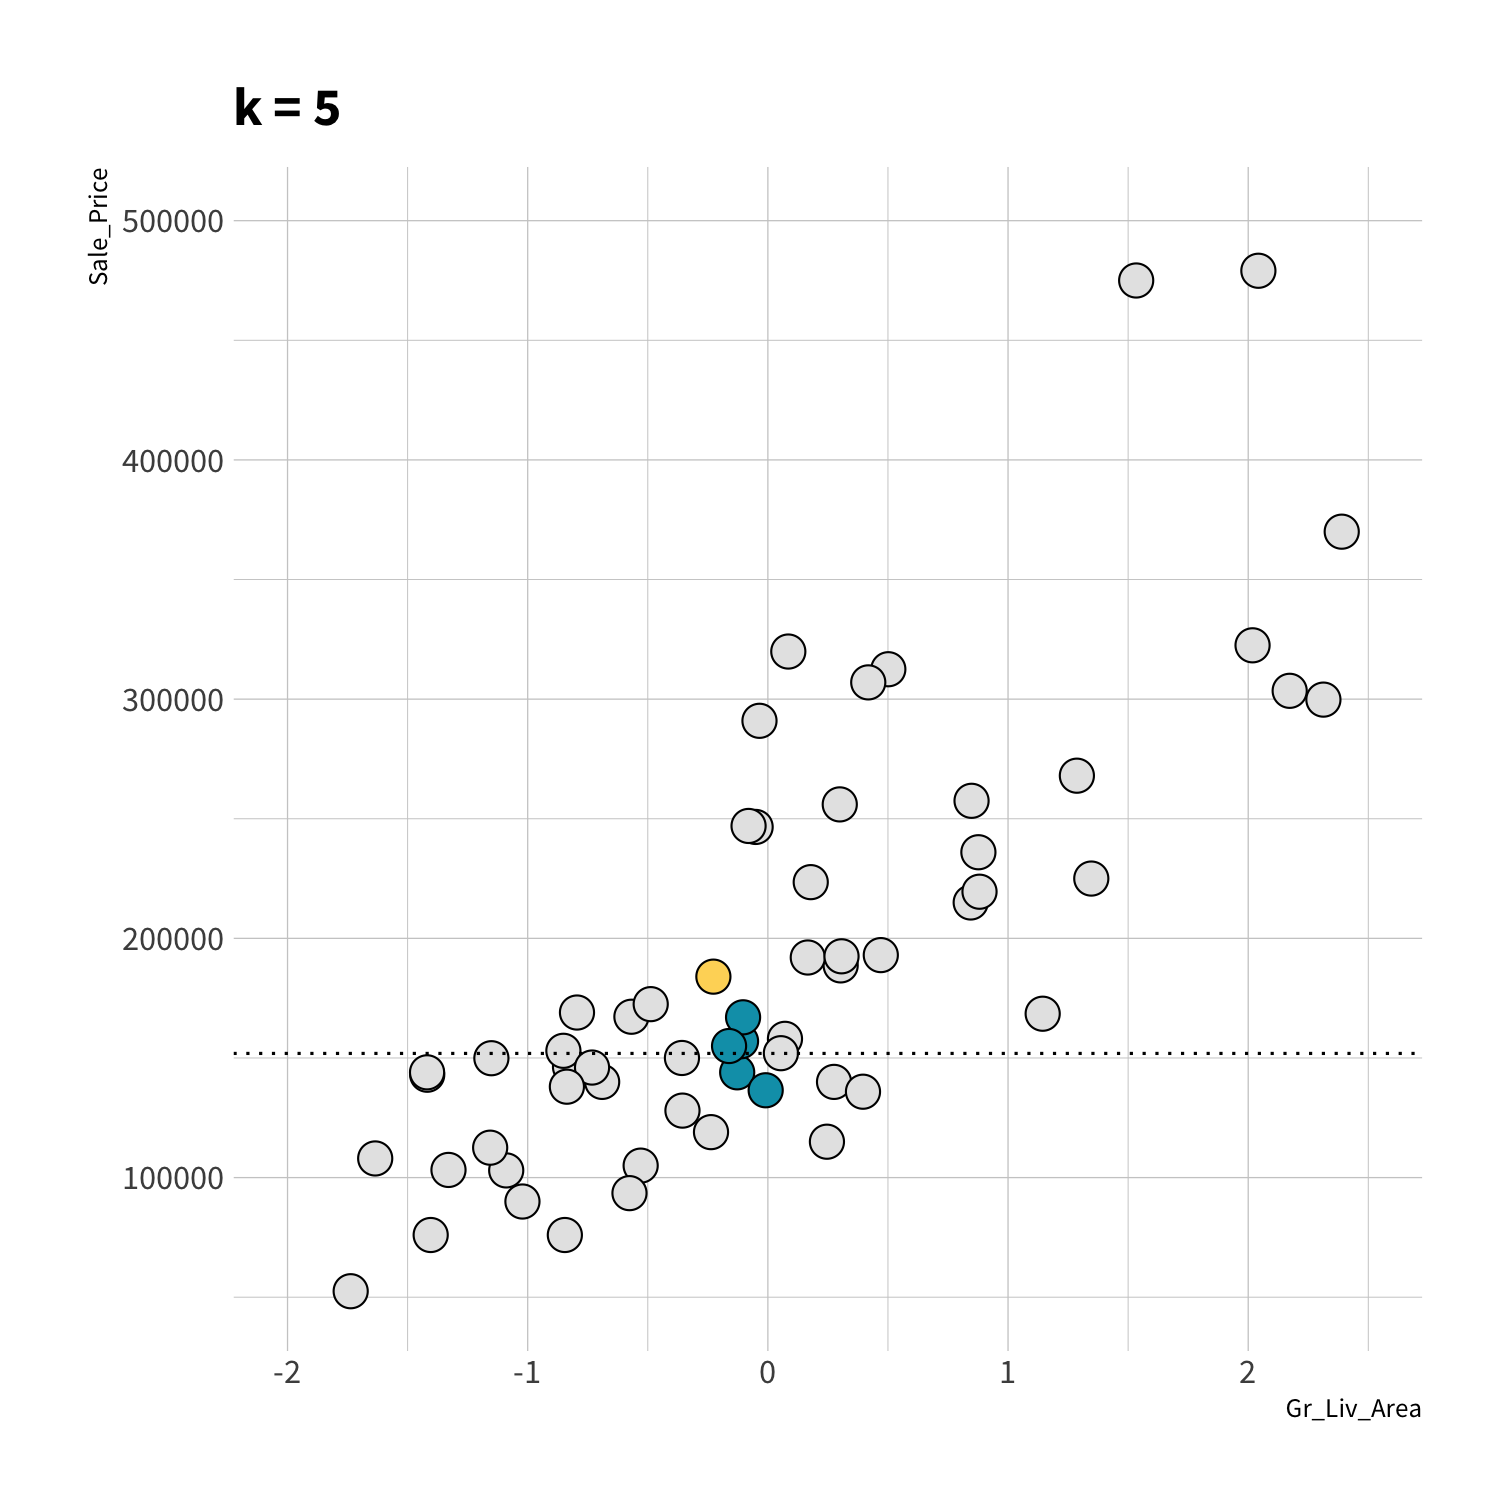

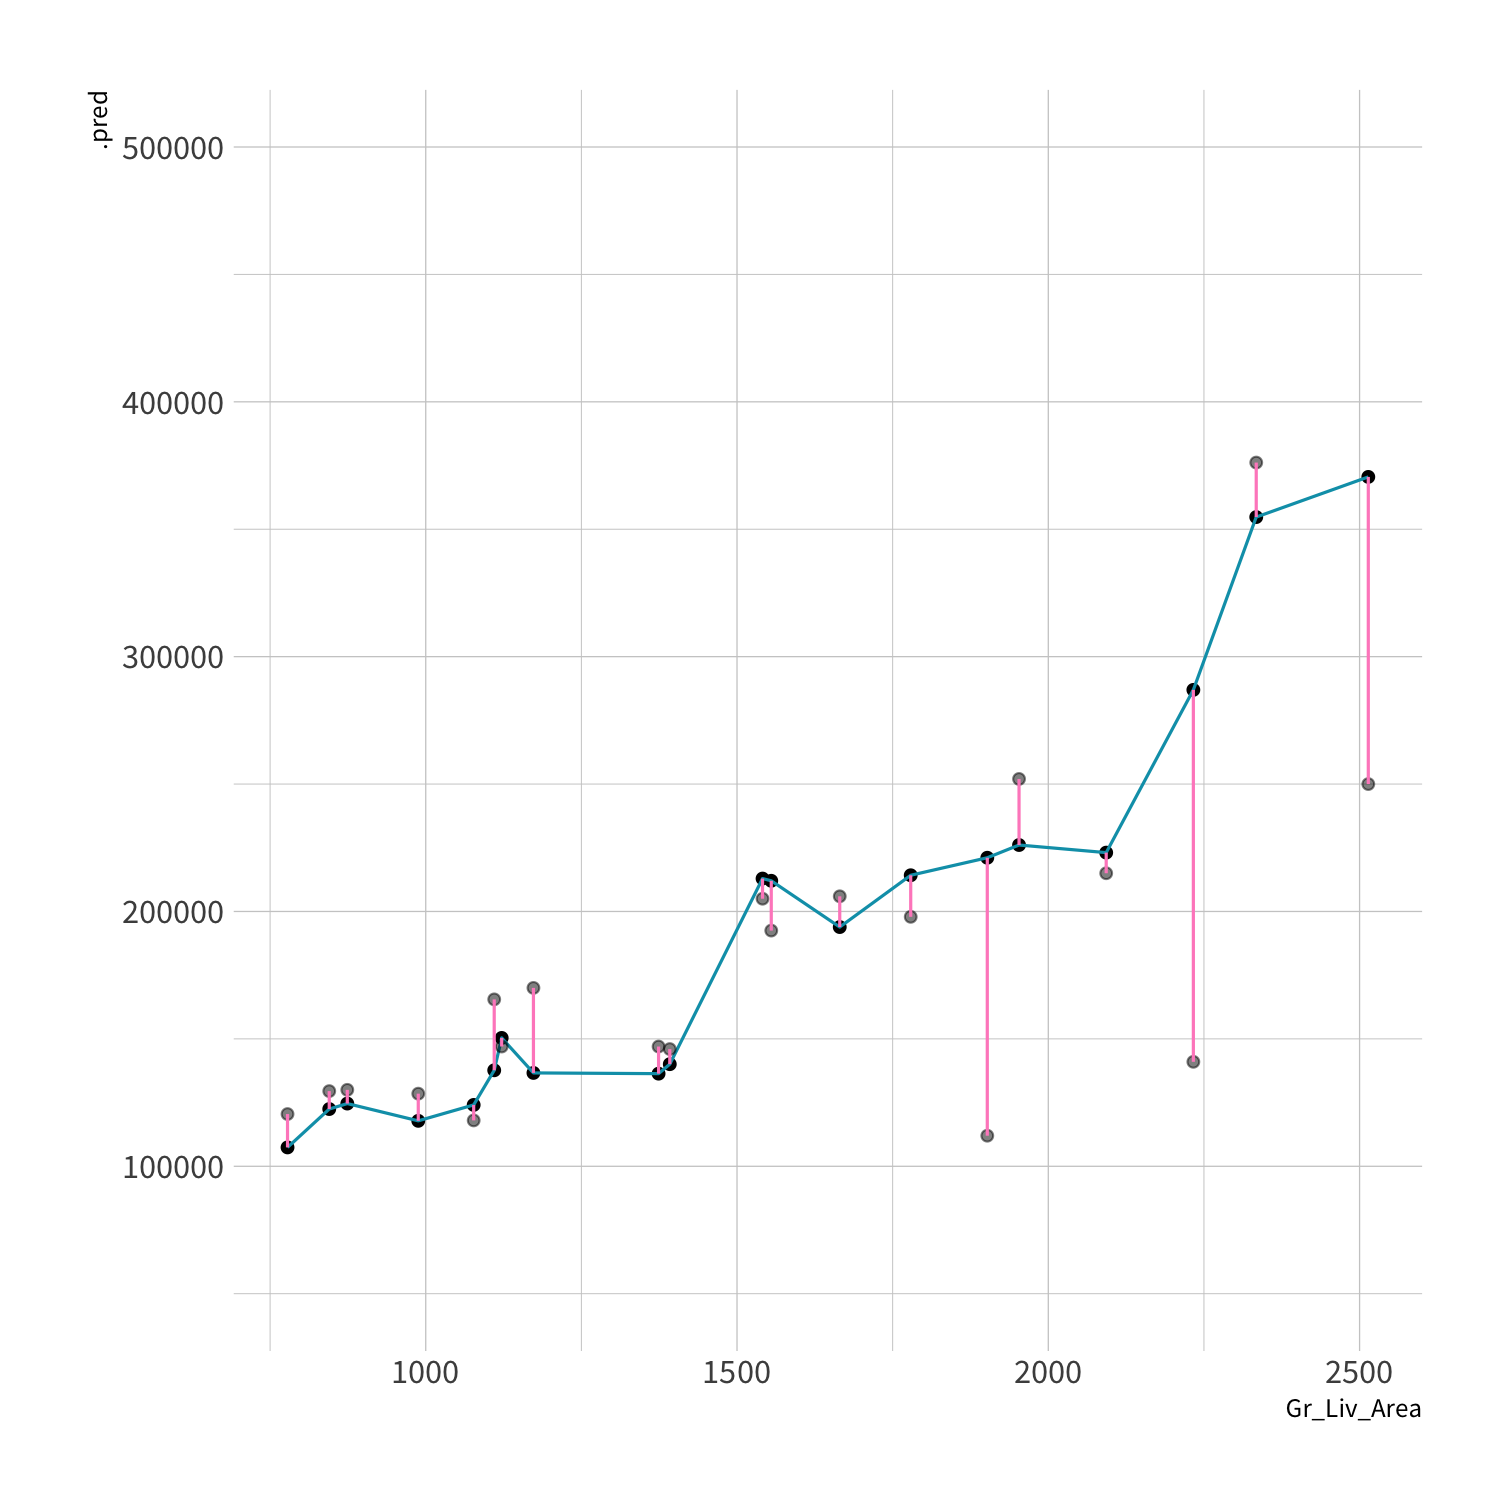

What makes a good guesser?
What makes a good guesser?
High information gain per question (can it fly?)
What makes a good guesser?
High information gain per question (can it fly?)
Clear features (feathers vs. is it "small"?)
What makes a good guesser?
High information gain per question (can it fly?)
Clear features (feathers vs. is it "small"?)
Order matters
Congratulations!
You just built a decision tree 🎉
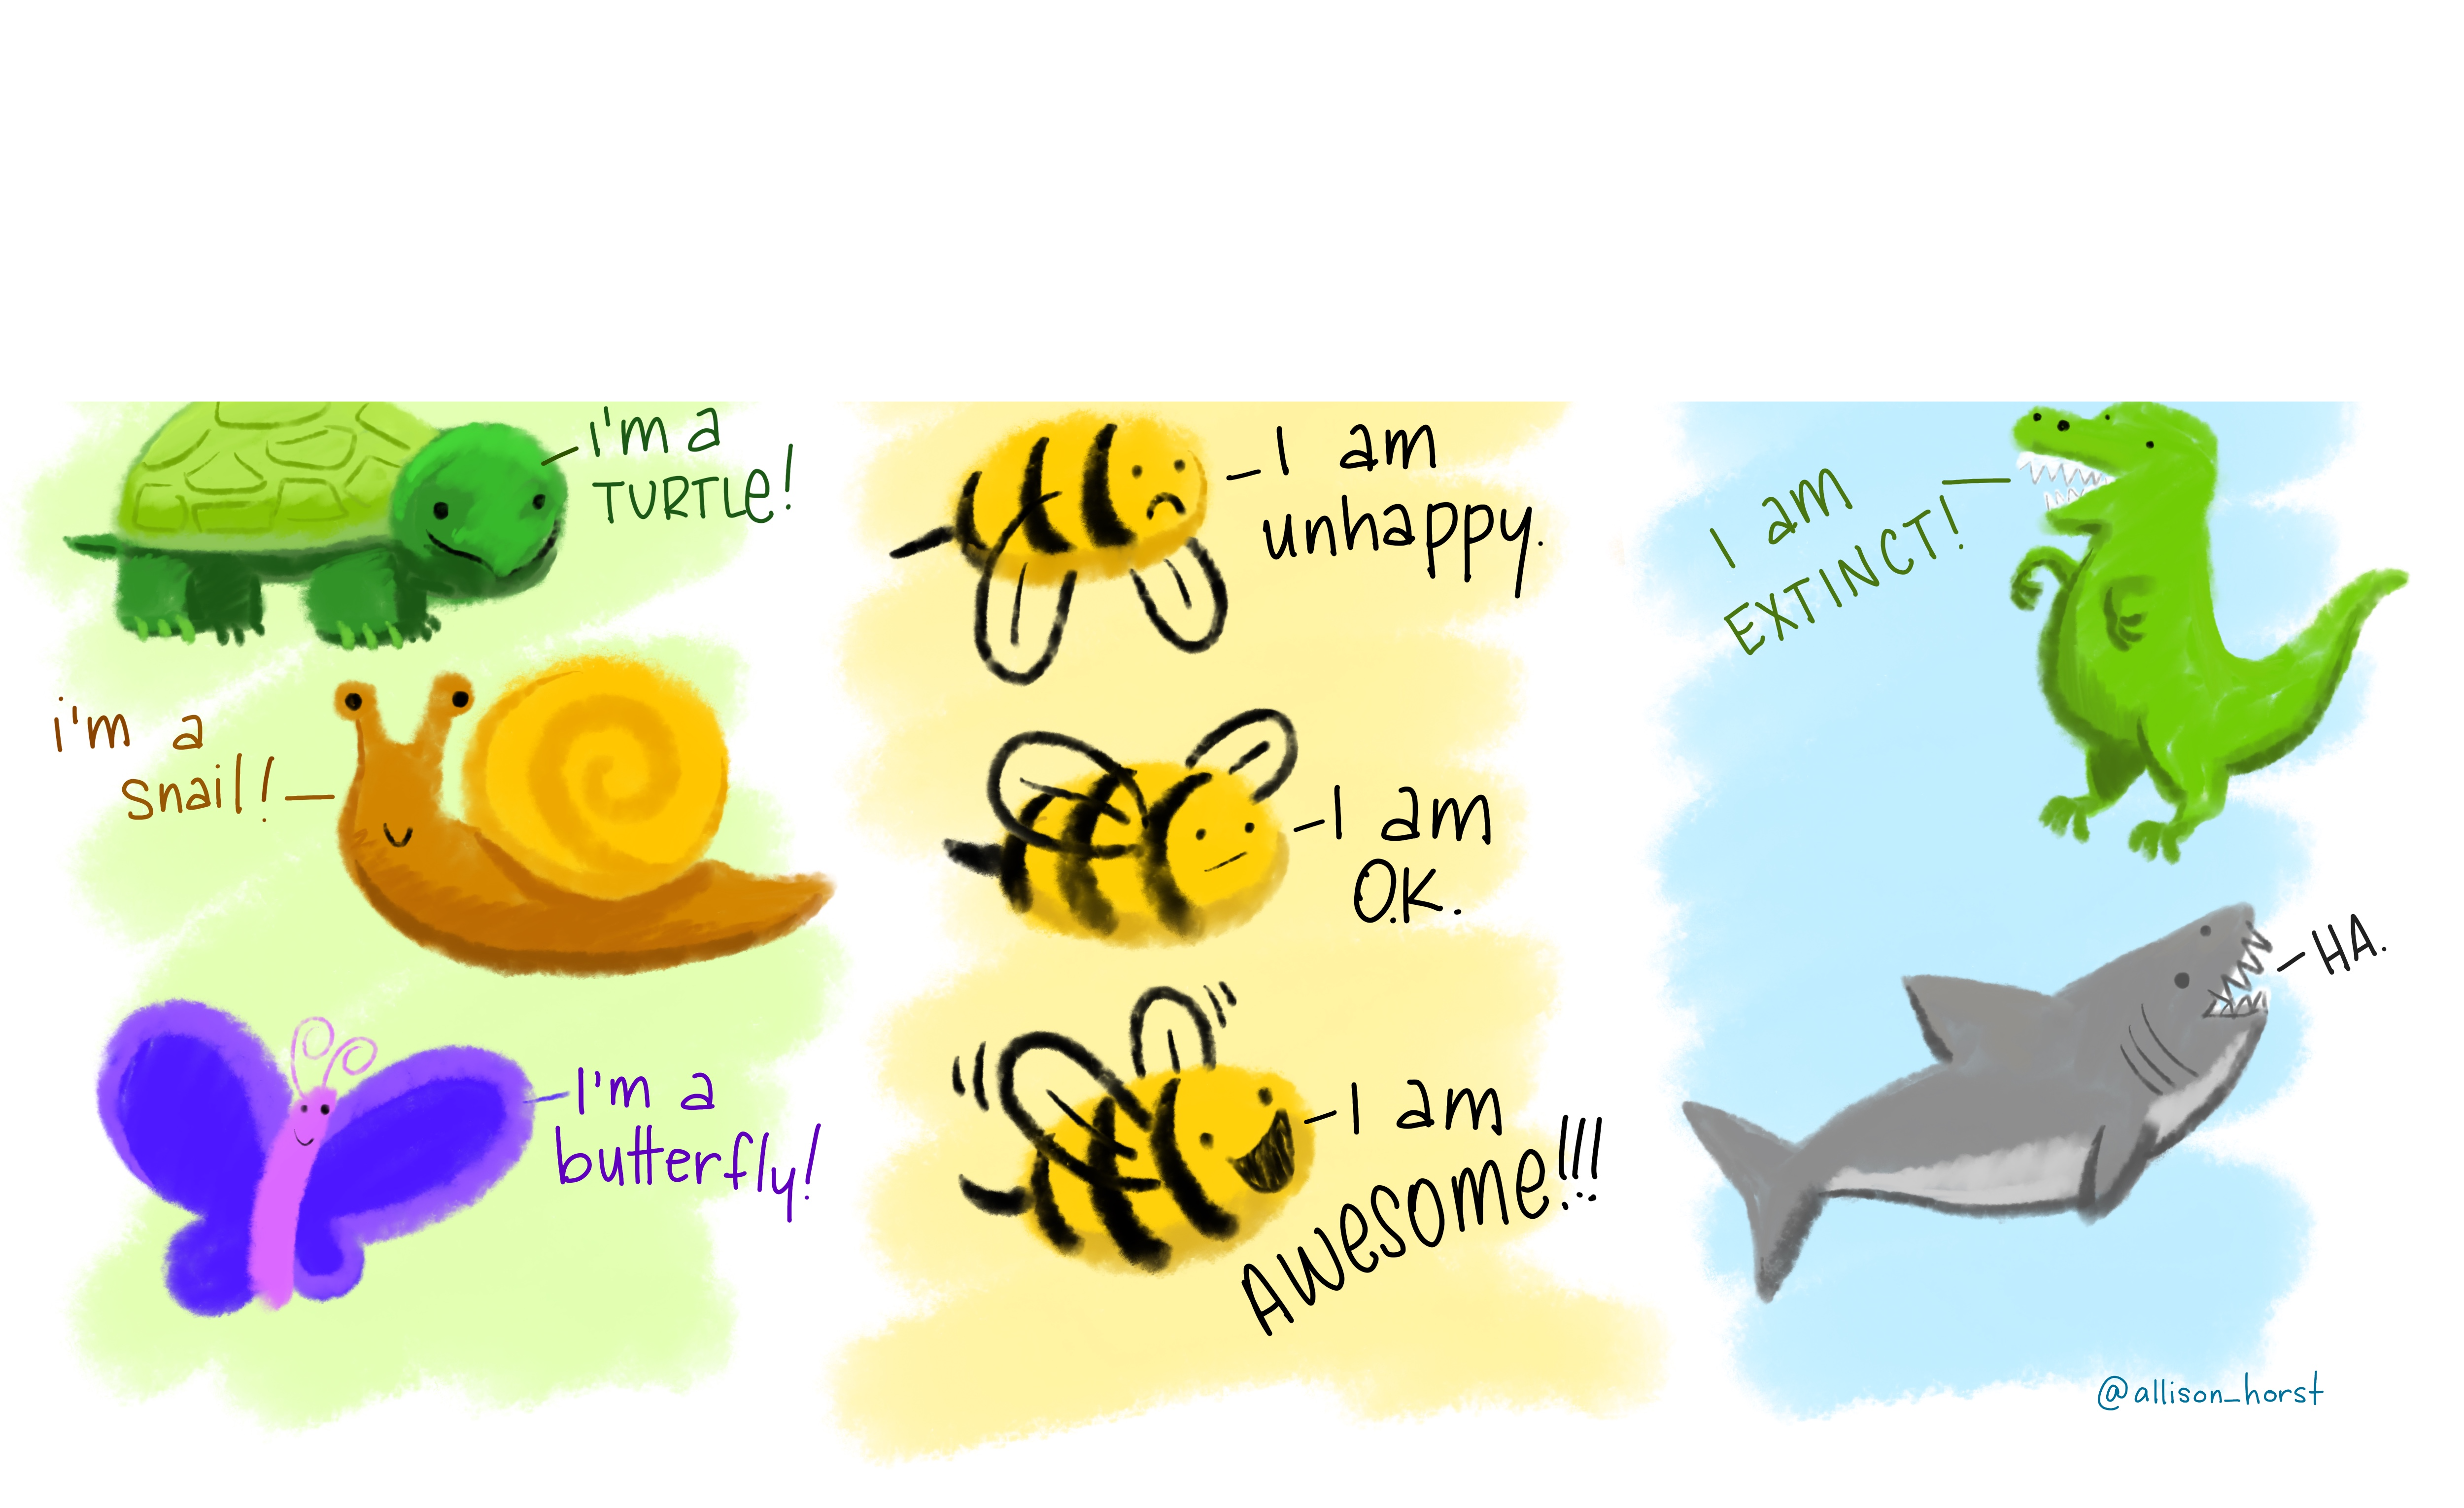
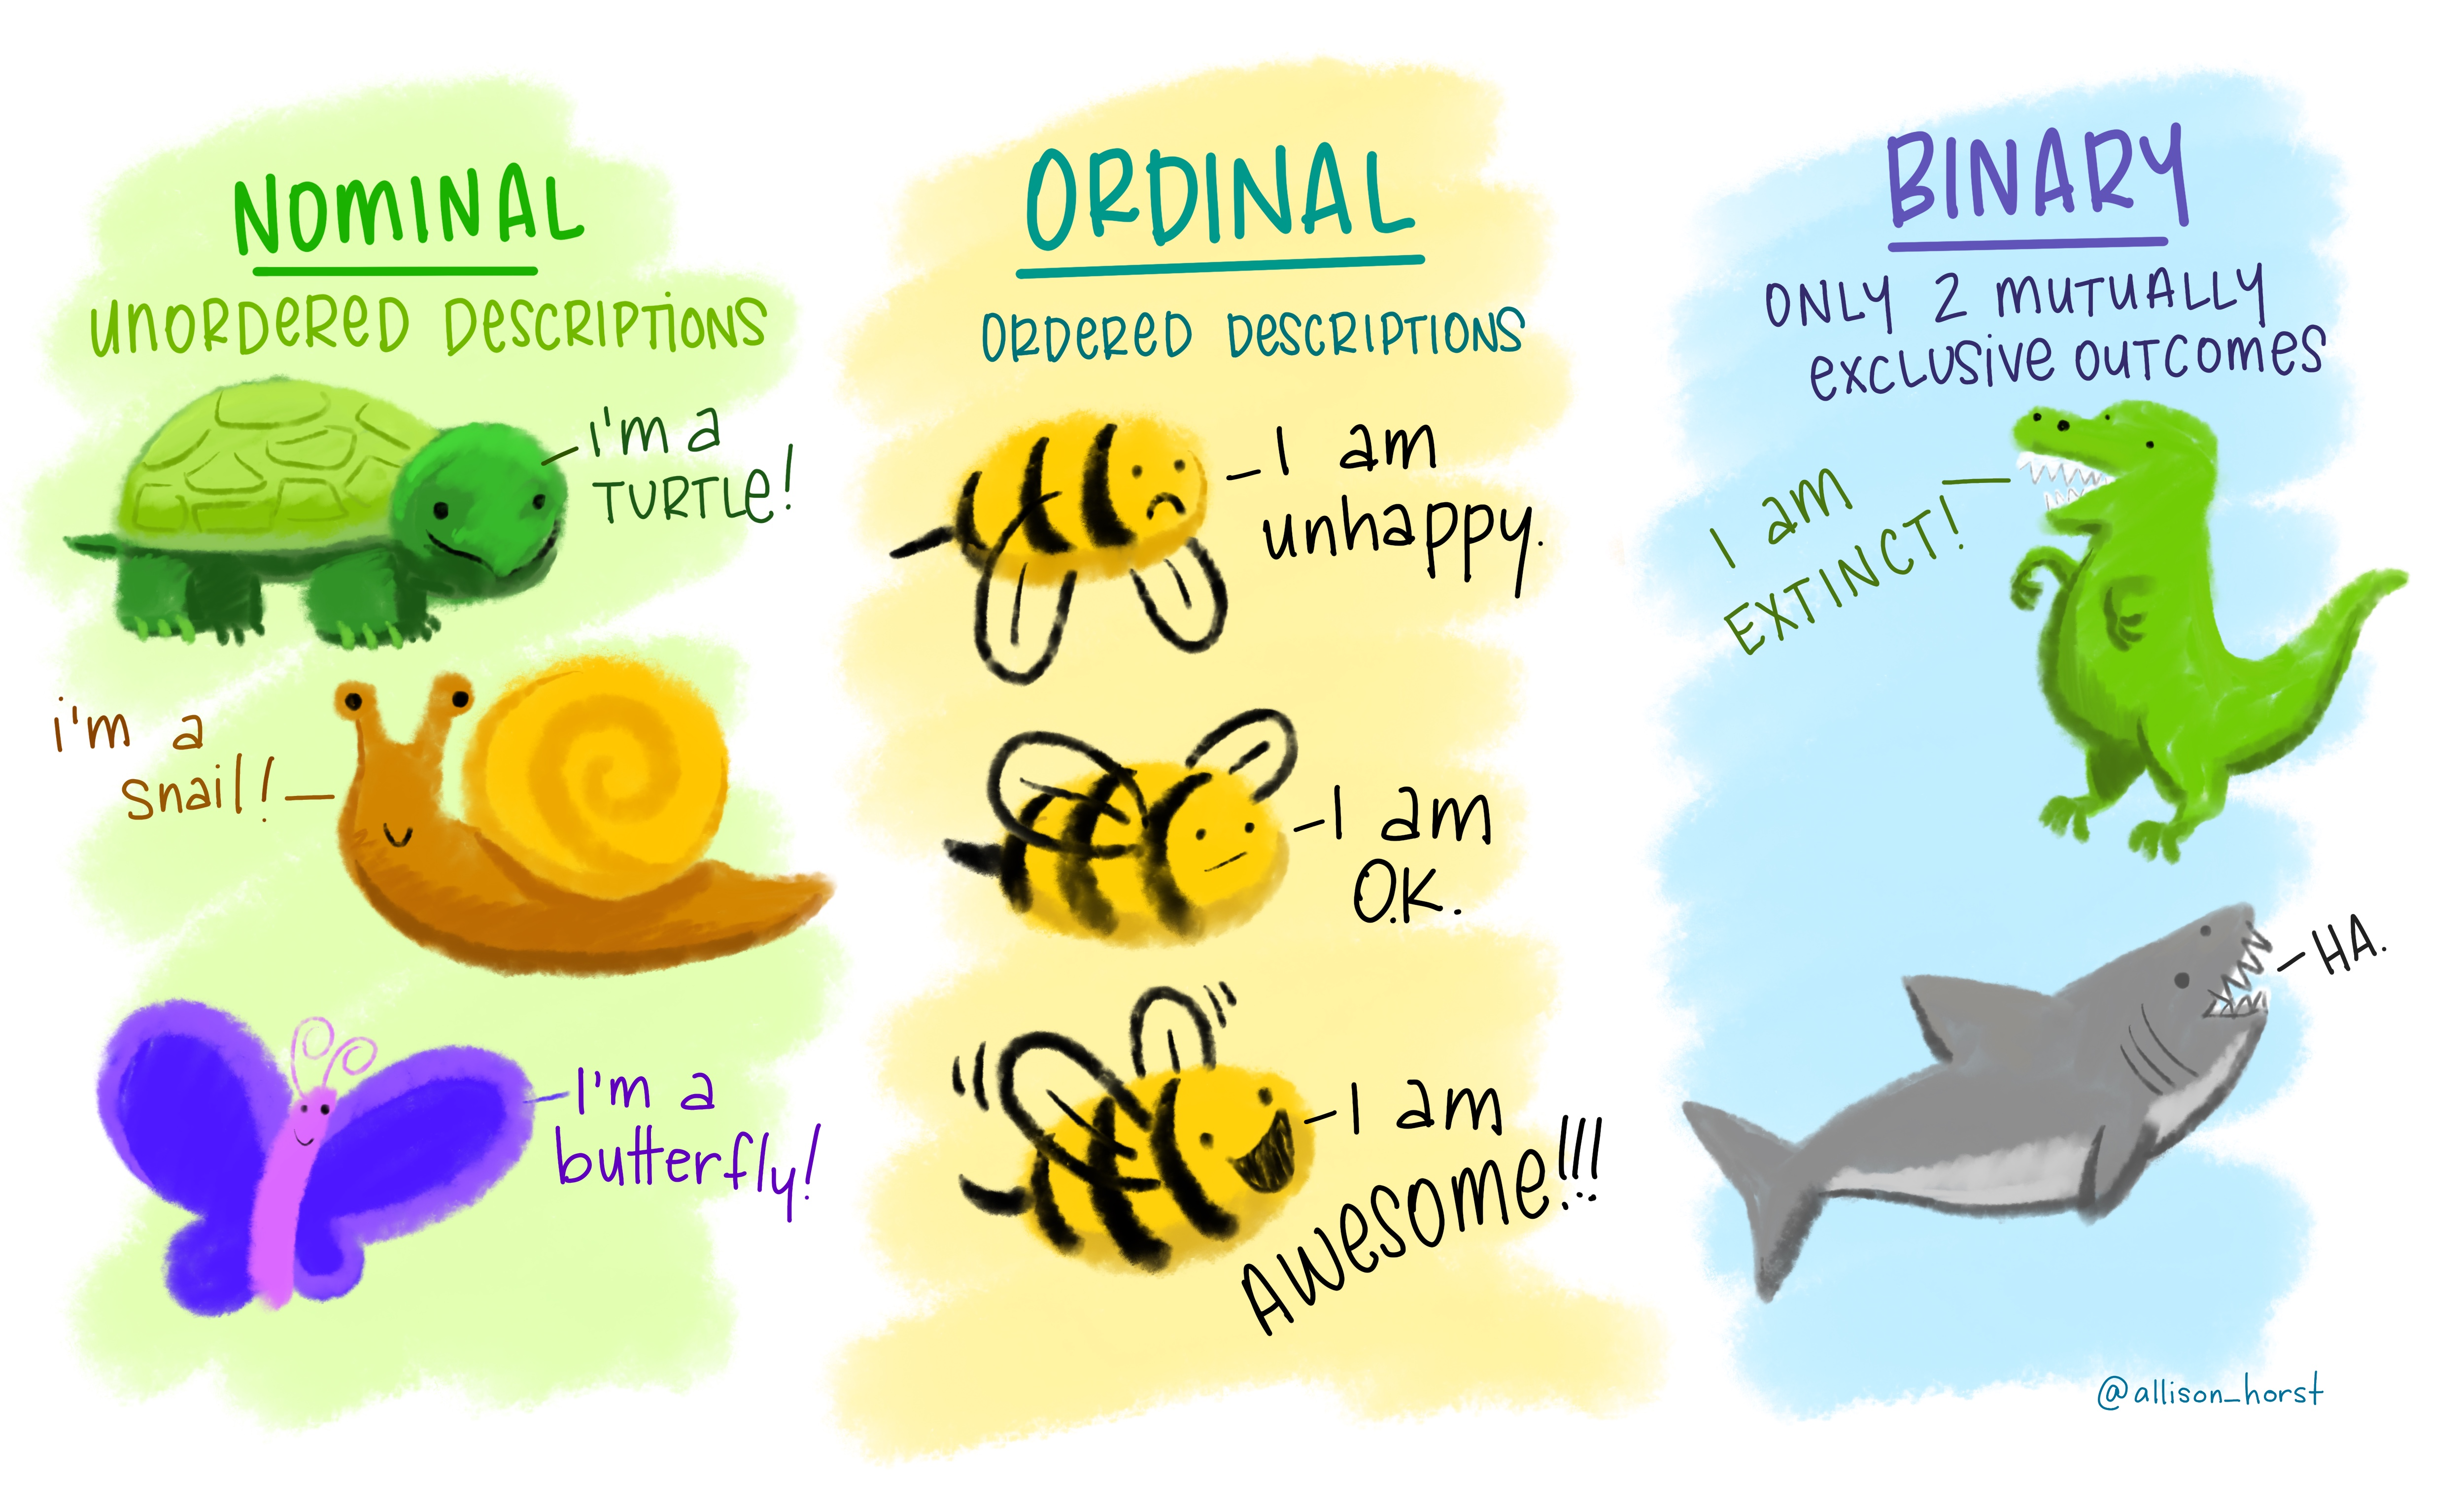
Pop quiz!
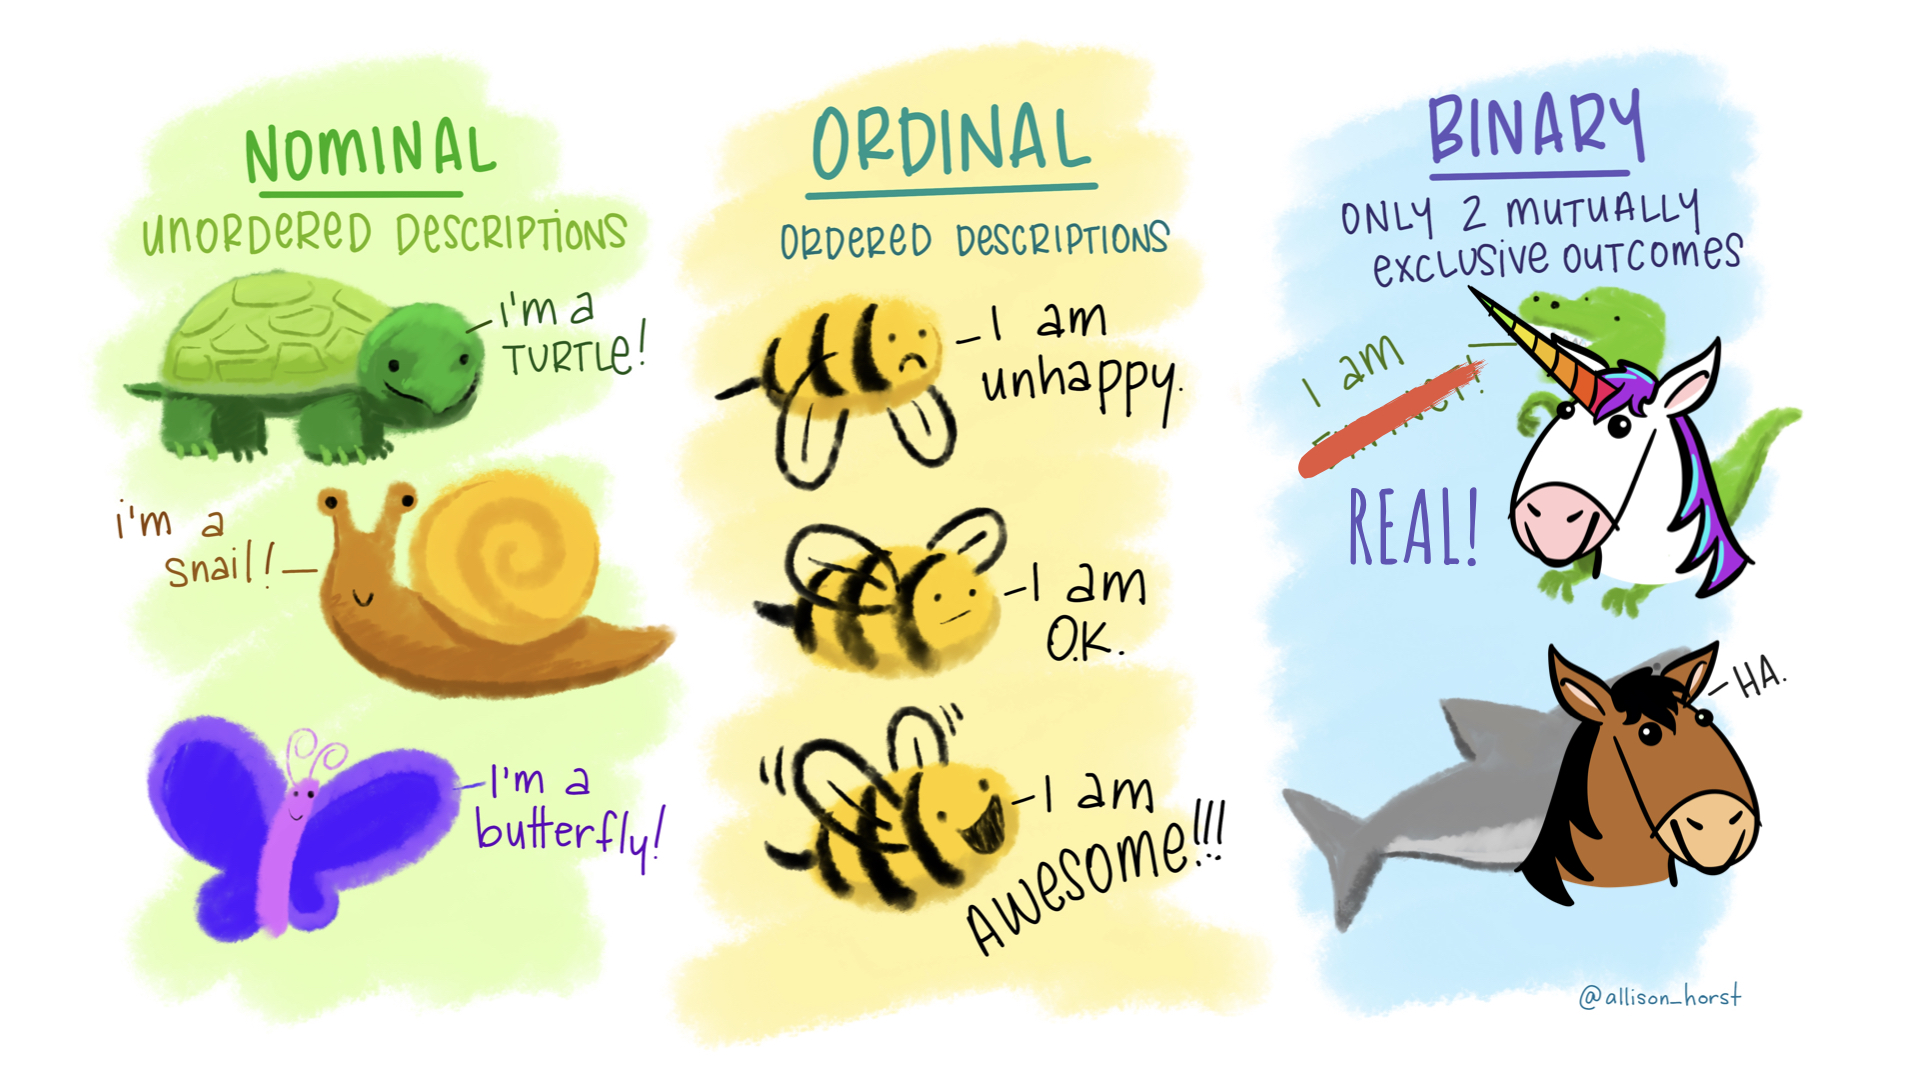
Name that variable type!
02:00
Show of hands
How many people have fit a logistic regression model with glm()?


uni_train %>% count(unicorn)#> unicorn n#> 1 0 100#> 2 1 50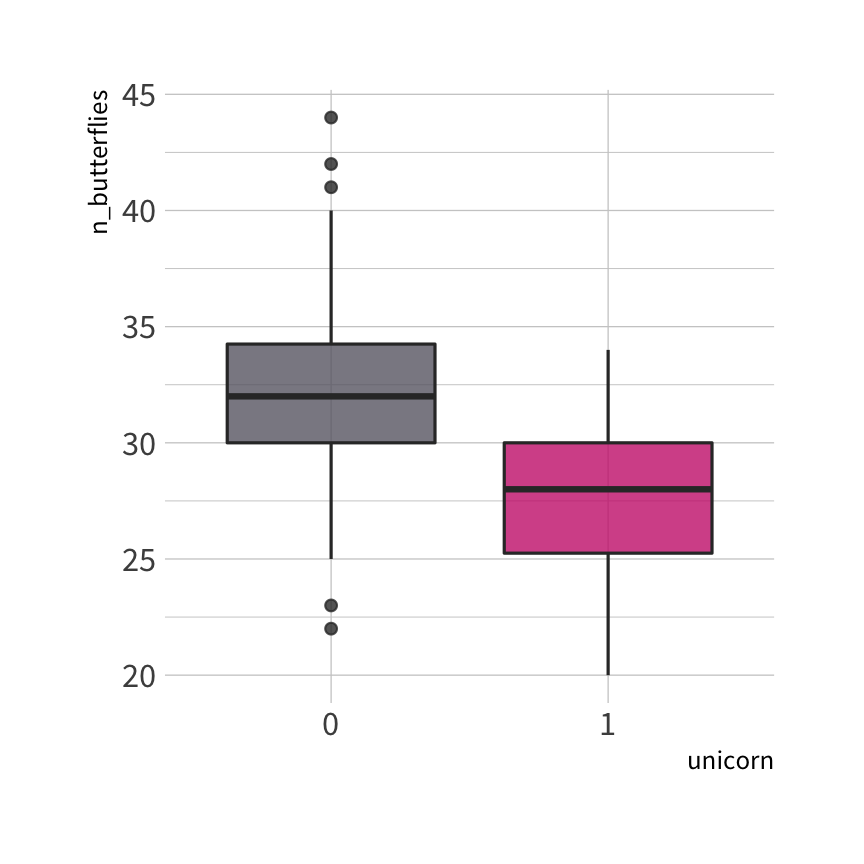
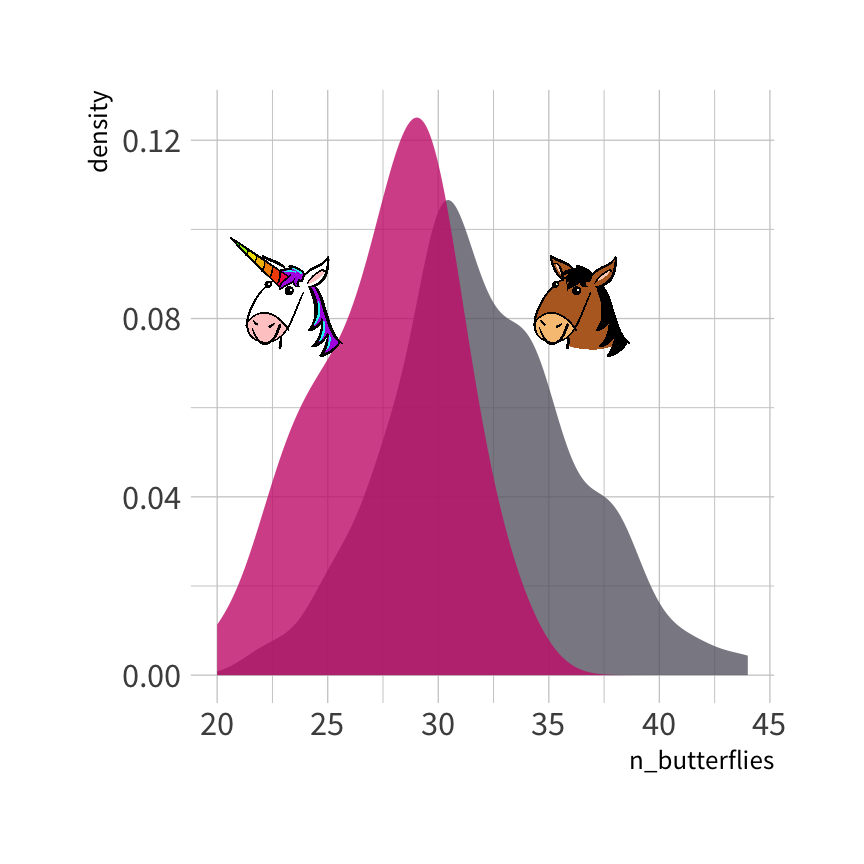
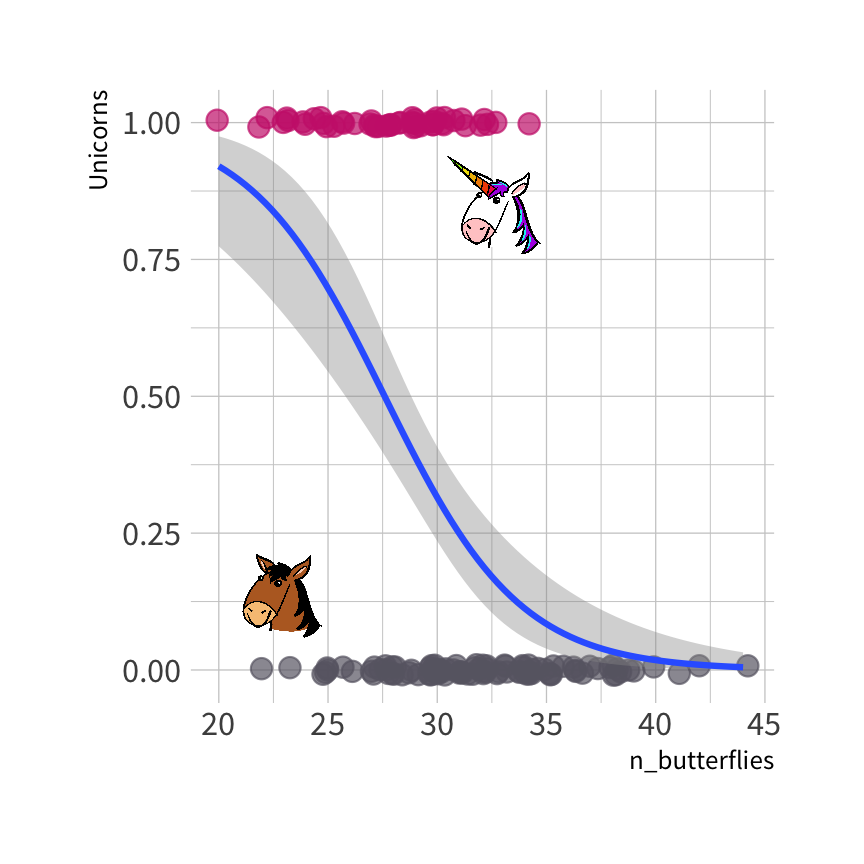
Logistic regression model
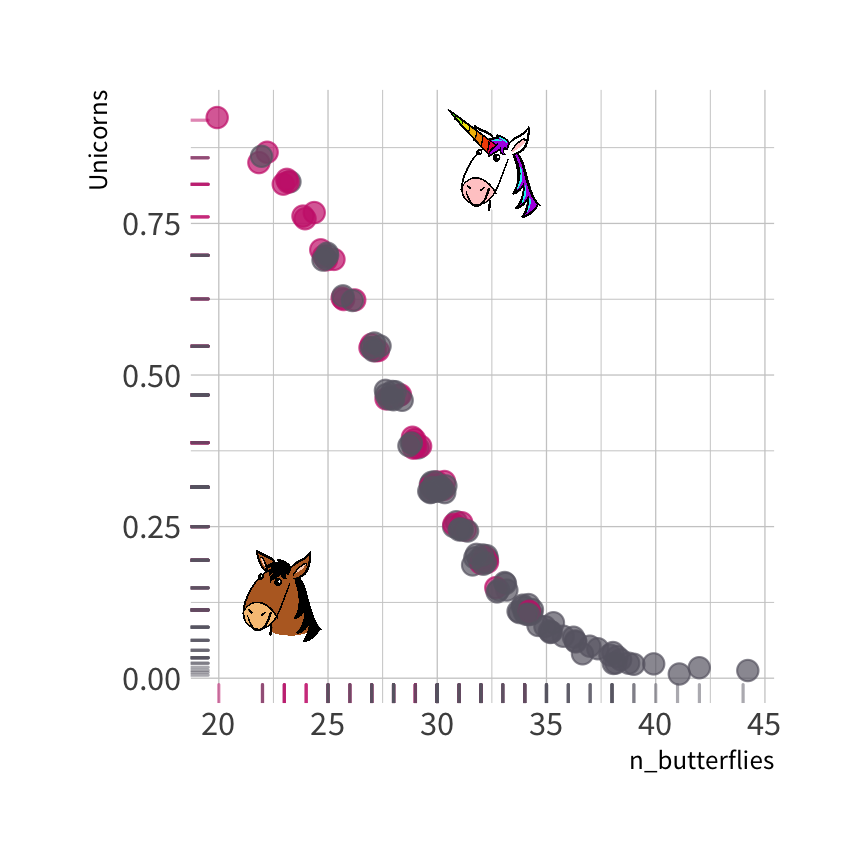
The probability that each observation is a unicorn
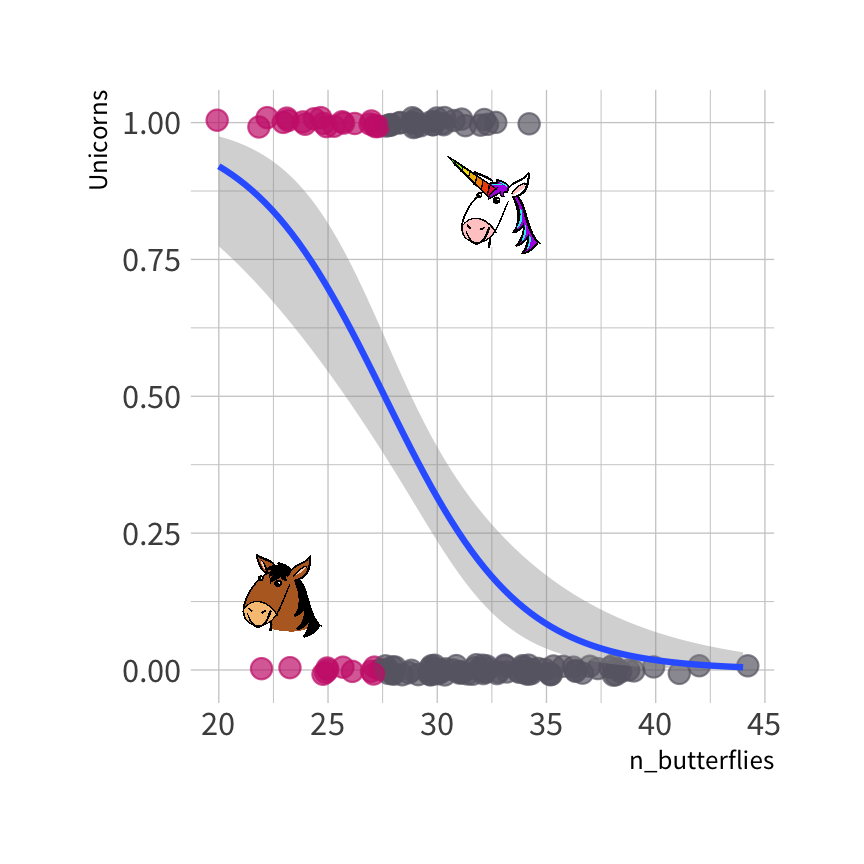
Predicted class of each observation
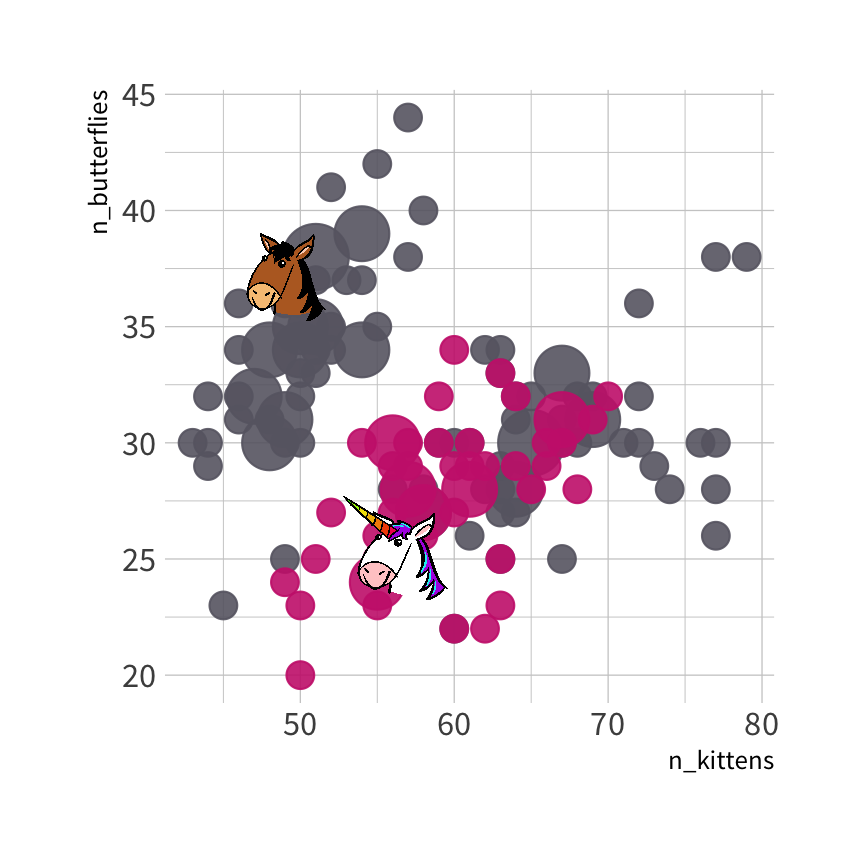
#> parsnip model object#> #> Fit time: 2ms #> n= 150 #> #> node), split, n, loss, yval, (yprob)#> * denotes terminal node#> #> 1) root 150 50 0 (0.6666667 0.3333333) #> 2) n_butterflies>=29.5 93 16 0 (0.8279570 0.1720430) *#> 3) n_butterflies< 29.5 57 23 1 (0.4035088 0.5964912) #> 6) n_kittens>=62.5 18 6 0 (0.6666667 0.3333333) *#> 7) n_kittens< 62.5 39 11 1 (0.2820513 0.7179487) *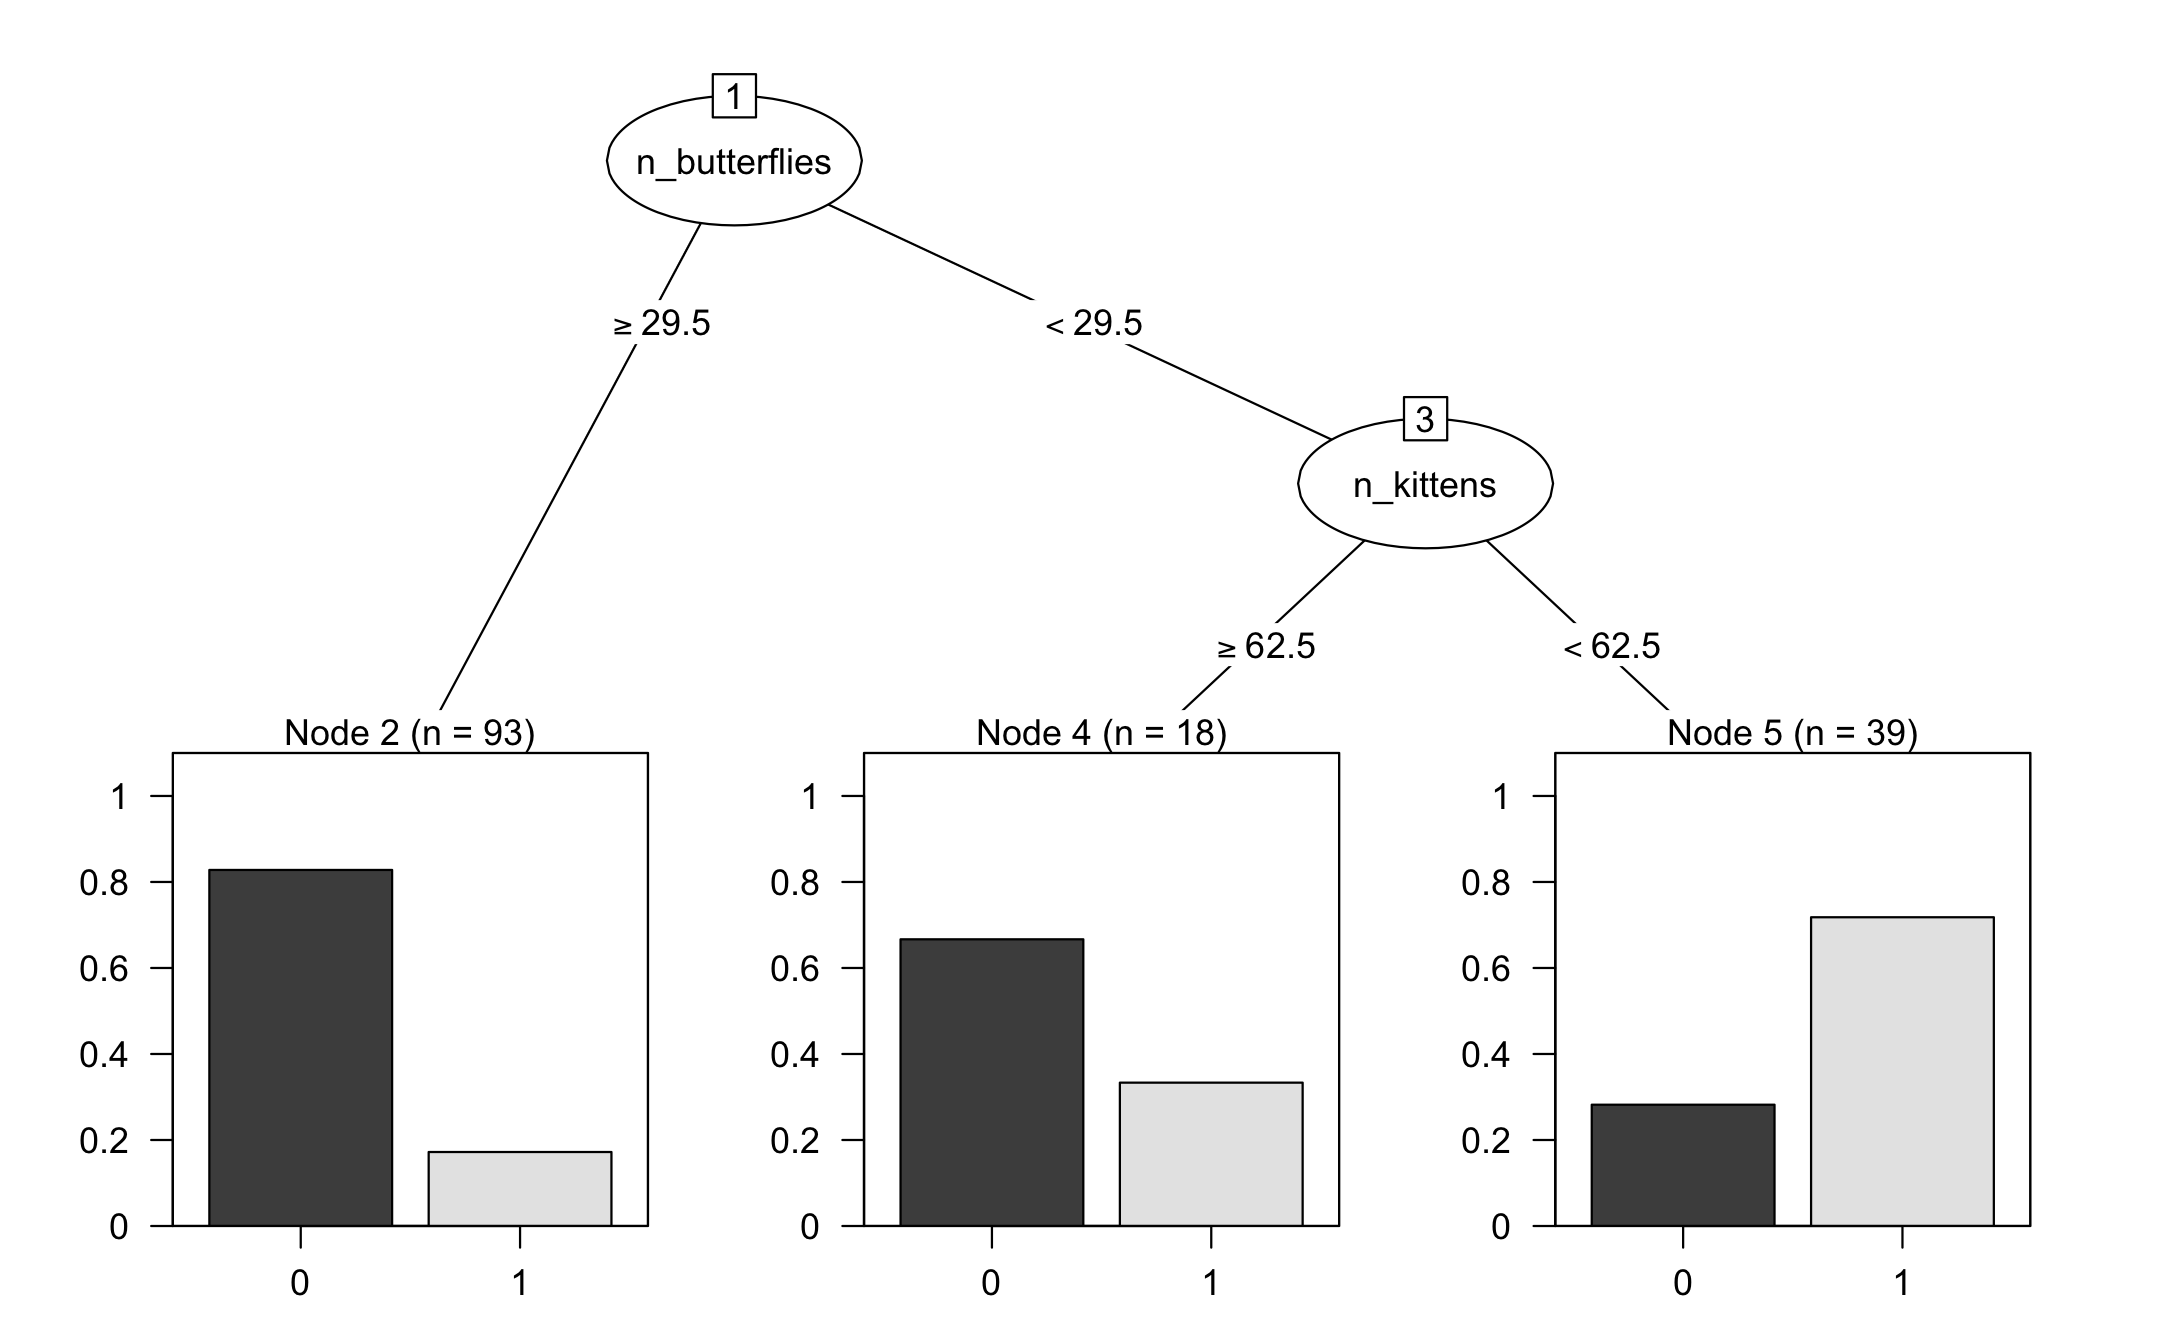
#> nn ..y 0 1 cover#> 2 0 [.83 .17] when n_butterflies >= 30 62%#> 6 0 [.67 .33] when n_butterflies < 30 & n_kittens >= 63 12%#> 7 1 [.28 .72] when n_butterflies < 30 & n_kittens < 63 26%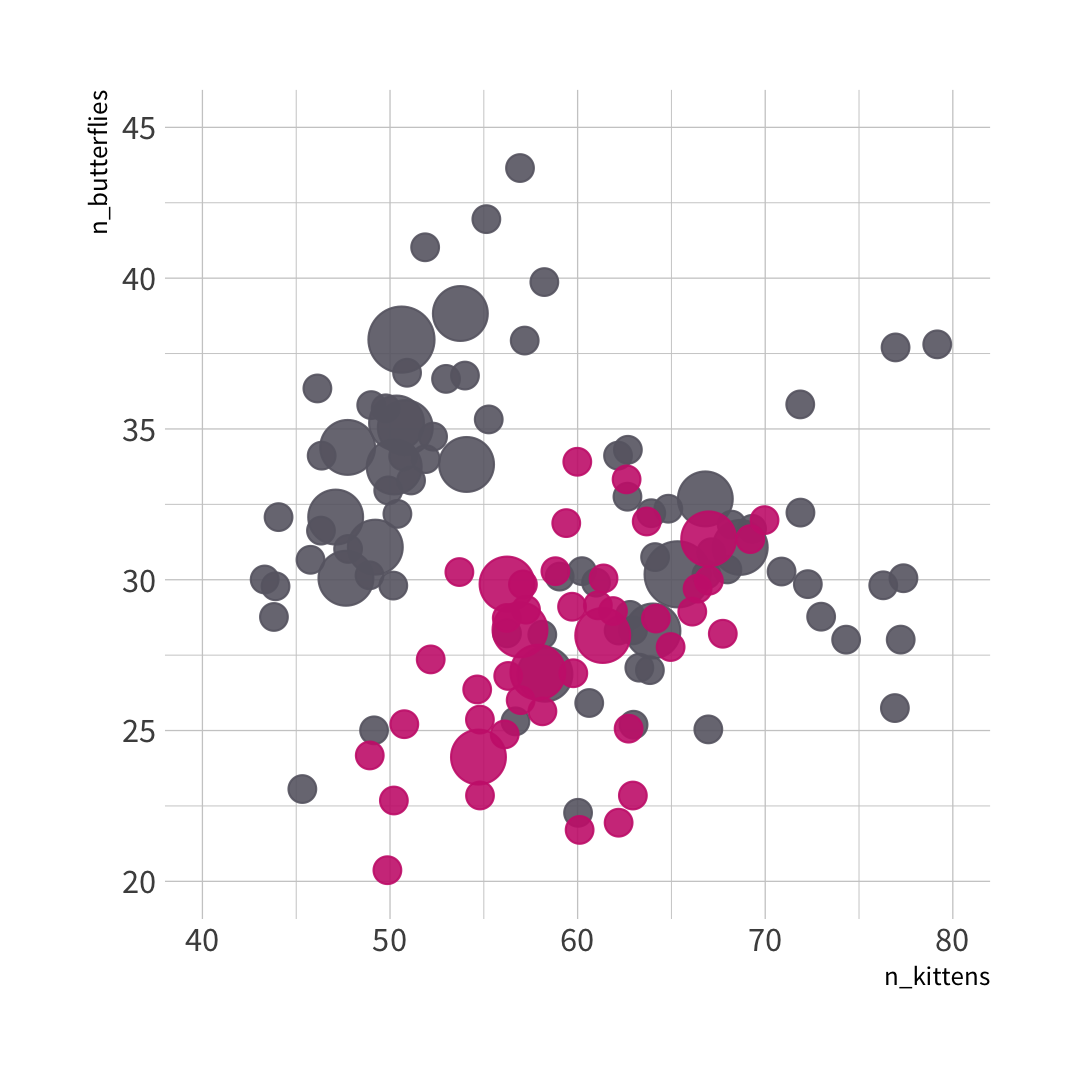

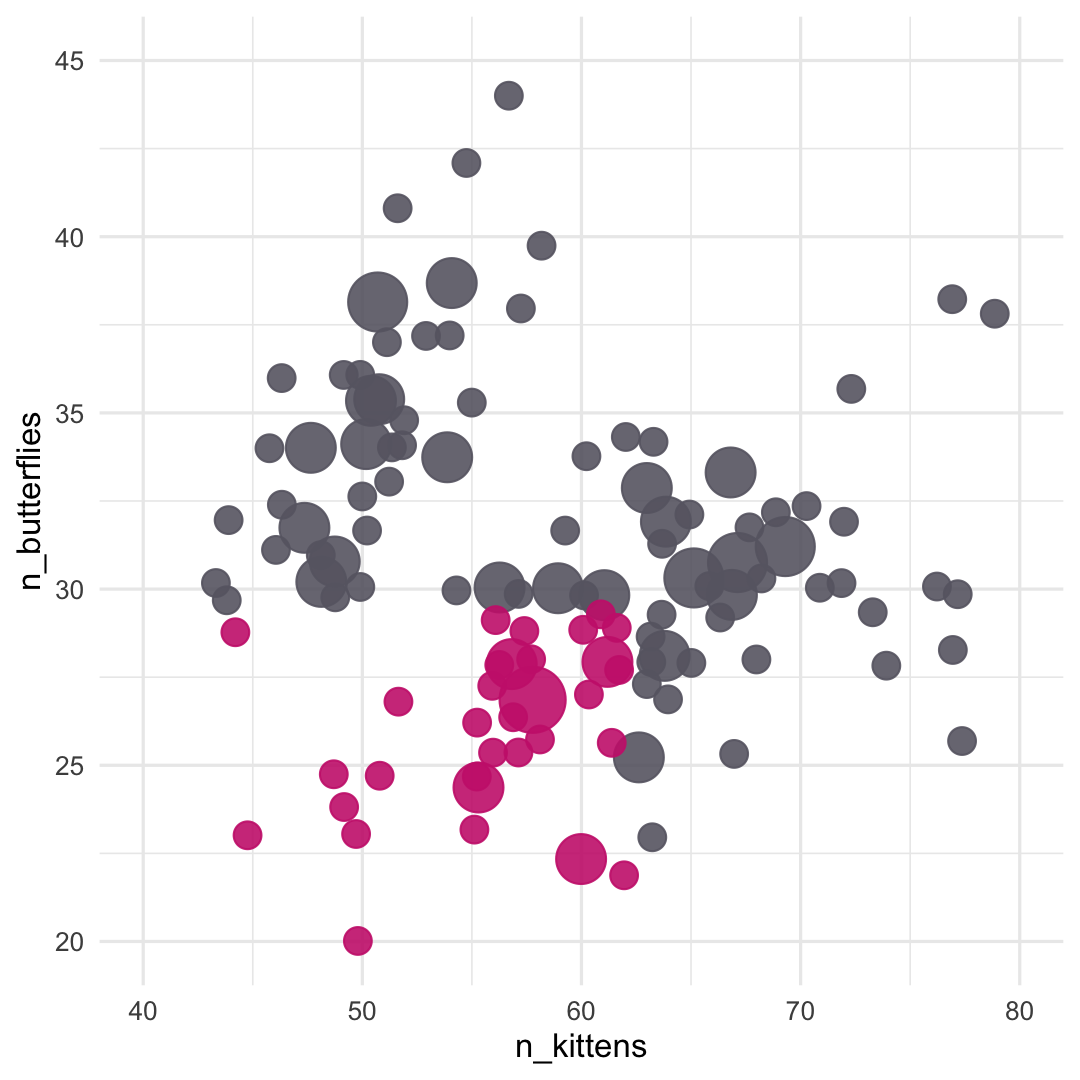
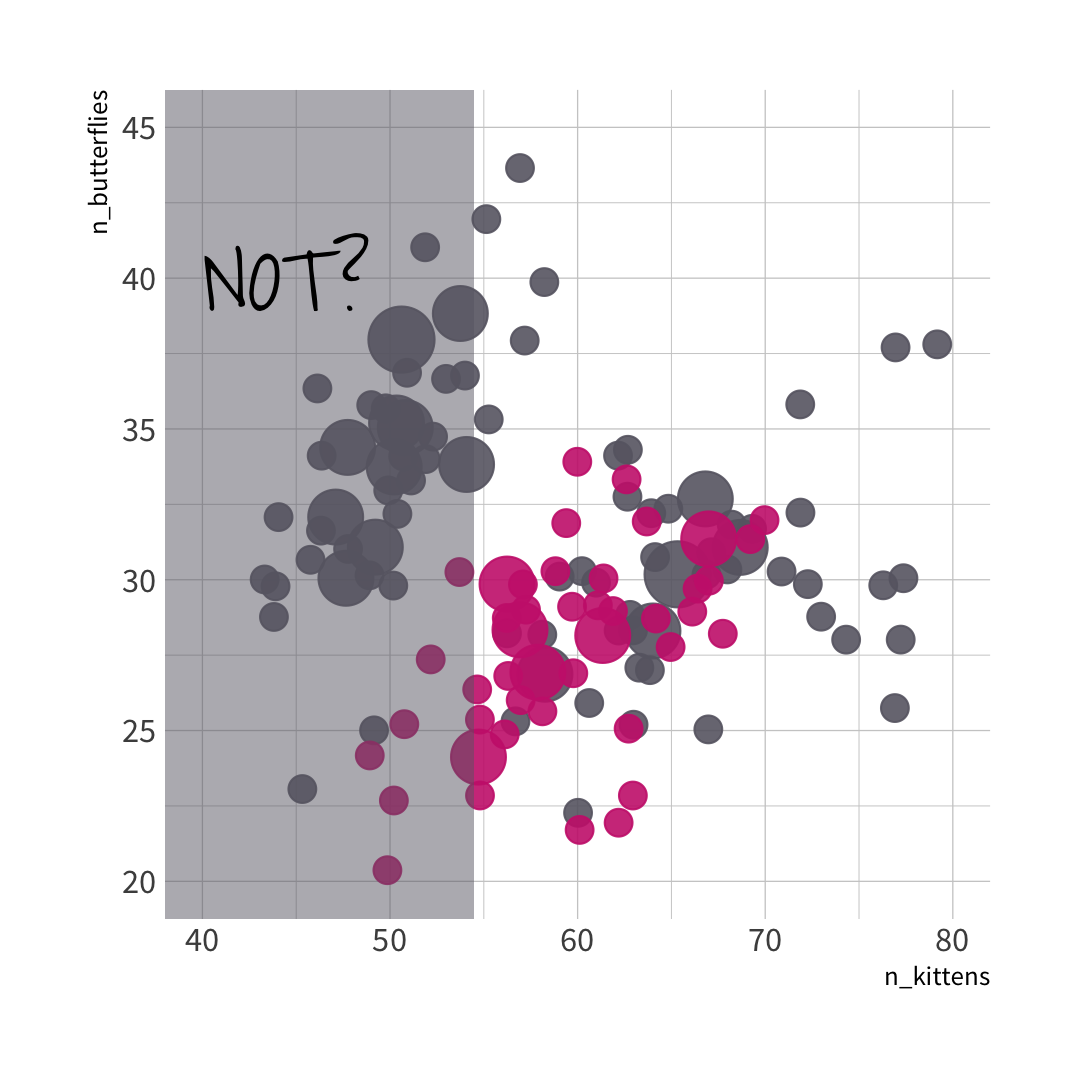

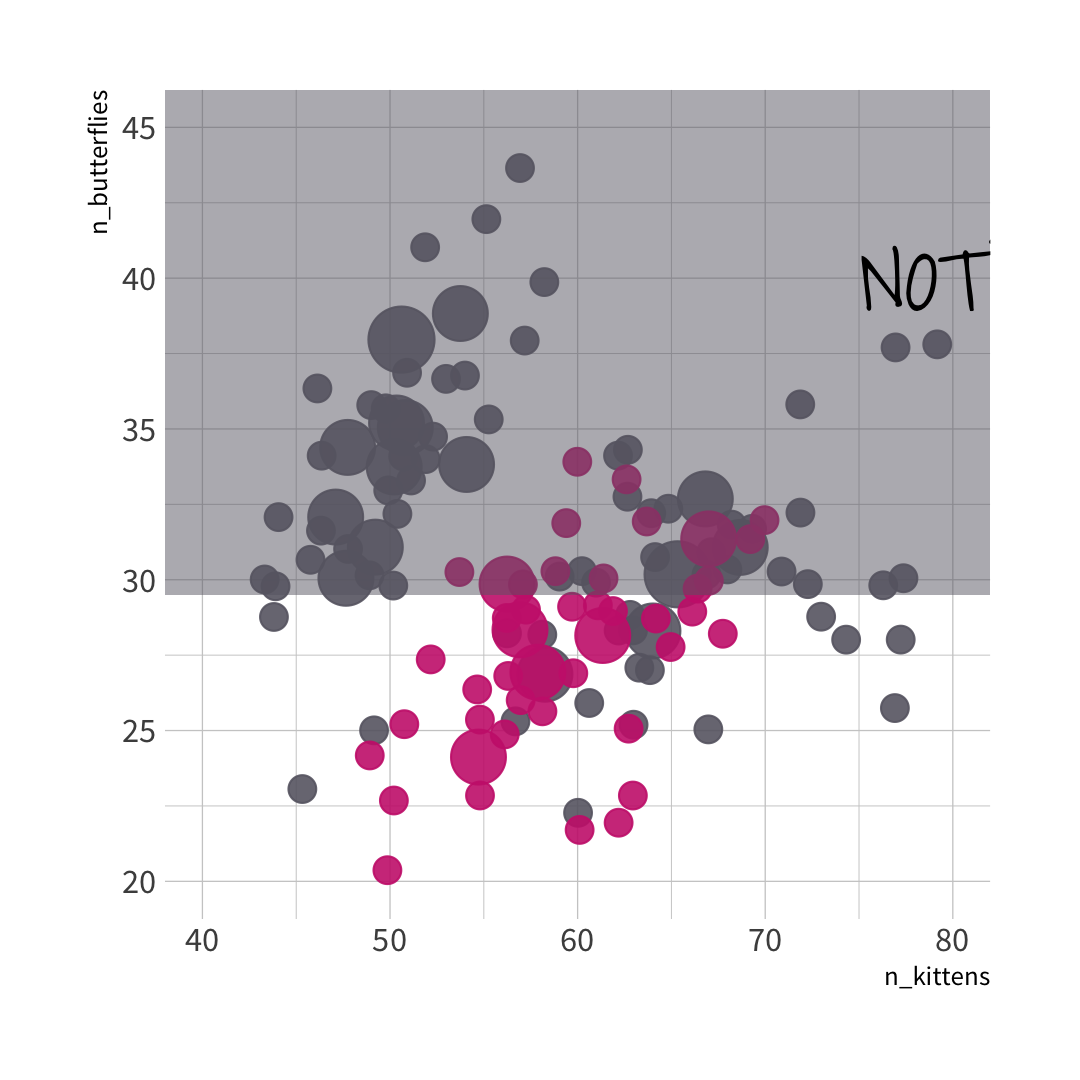


🦋 split wins
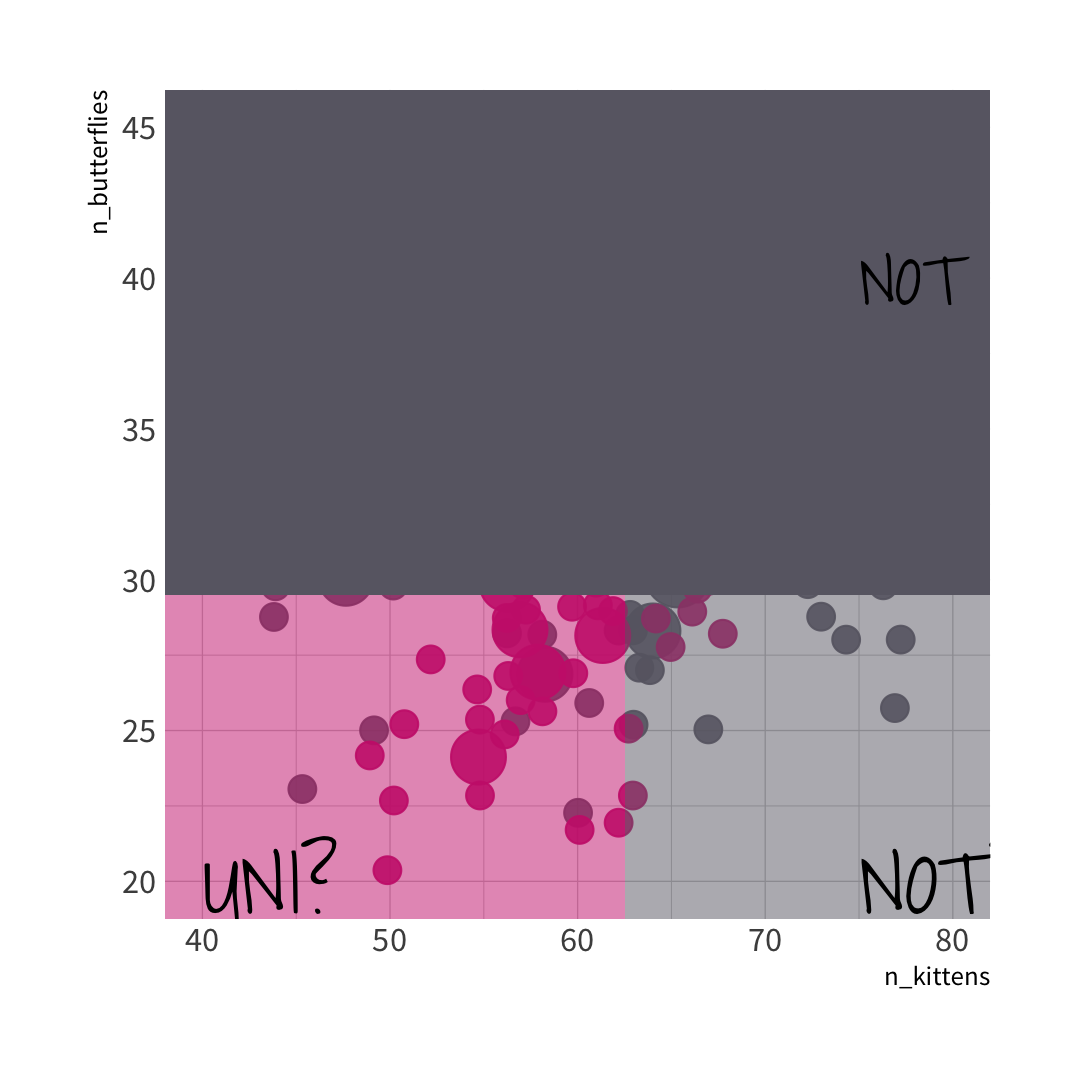

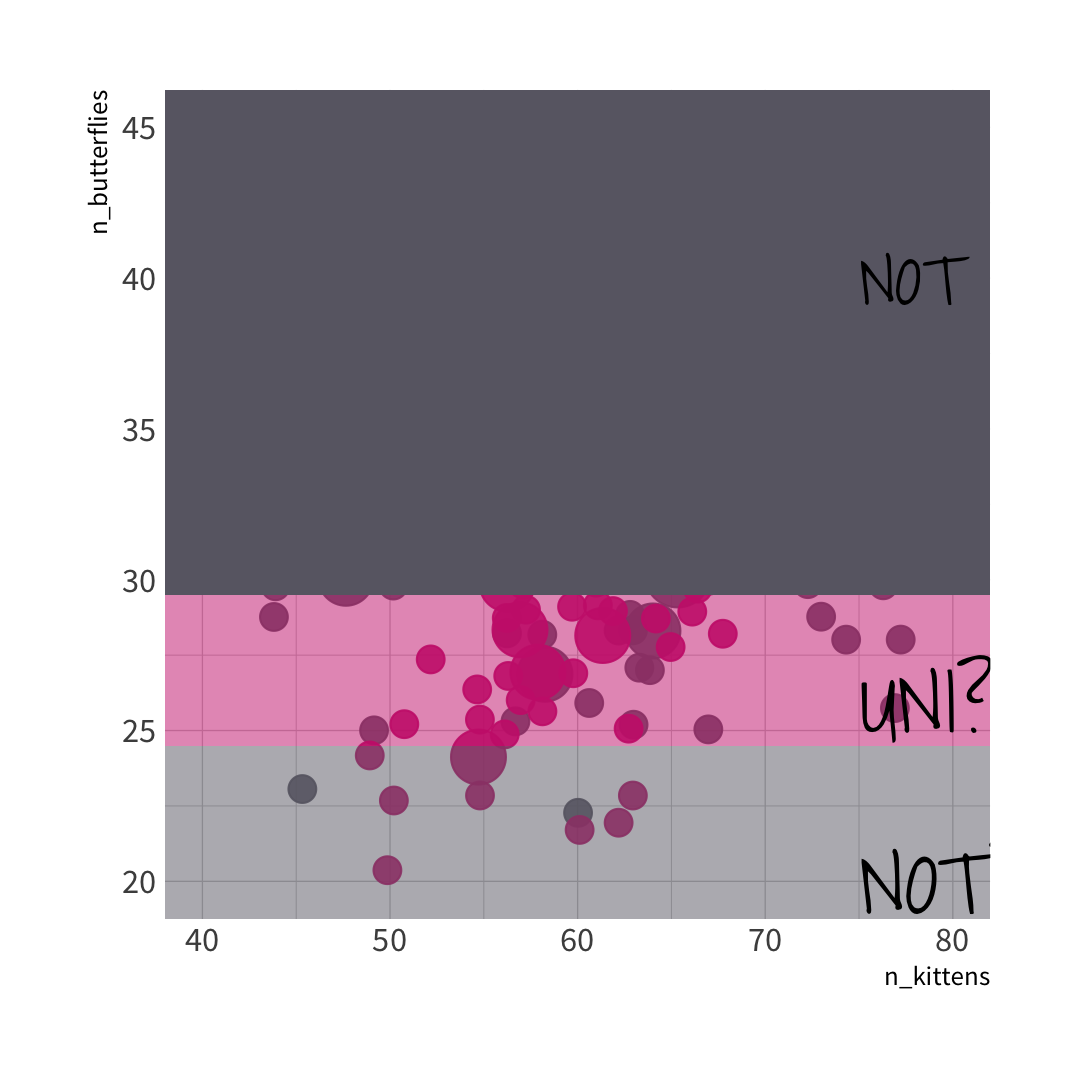


🐱 split wins
Sadly, we are not classifying unicorns today

Notes: The specific question we are going to address is what makes a developer more likely to work remotely. Developers can work in their company offices or they can work remotely, and it turns out that there are specific characteristics of developers, such as the size of the company that they work for, how much experience they have, or where in the world they live, that affect how likely they are to be a remote developer.
StackOverflow Data
glimpse(stackoverflow)#> Rows: 1,150#> Columns: 21#> $ country <fct> United States, United States, Uni…#> $ salary <dbl> 63750.00, 93000.00, 40625.00, 450…#> $ years_coded_job <int> 4, 9, 8, 3, 8, 12, 20, 17, 20, 4,…#> $ open_source <dbl> 0, 1, 1, 1, 0, 1, 0, 0, 0, 0, 1, …#> $ hobby <dbl> 1, 1, 1, 0, 1, 1, 0, 1, 1, 1, 1, …#> $ company_size_number <dbl> 20, 1000, 10000, 1, 10, 100, 20, …#> $ remote <fct> Remote, Remote, Remote, Remote, R…#> $ career_satisfaction <int> 8, 8, 5, 10, 8, 10, 9, 7, 8, 7, 9…#> $ data_scientist <dbl> 0, 0, 1, 0, 0, 0, 0, 0, 0, 0, 0, …#> $ database_administrator <dbl> 1, 0, 1, 0, 0, 0, 0, 1, 0, 0, 0, …#> $ desktop_applications_developer <dbl> 1, 0, 1, 0, 0, 0, 0, 0, 0, 0, 0, …#> $ developer_with_stats_math_background <dbl> 0, 0, 0, 0, 0, 0, 0, 0, 1, 0, 0, …#> $ dev_ops <dbl> 0, 0, 0, 0, 0, 1, 0, 0, 0, 0, 0, …#> $ embedded_developer <dbl> 0, 0, 0, 0, 0, 0, 1, 0, 0, 0, 0, …#> $ graphic_designer <dbl> 0, 0, 0, 0, 0, 0, 0, 0, 0, 0, 0, …#> $ graphics_programming <dbl> 0, 0, 0, 0, 0, 0, 0, 0, 0, 0, 0, …#> $ machine_learning_specialist <dbl> 0, 0, 0, 0, 0, 0, 0, 0, 0, 0, 0, …#> $ mobile_developer <dbl> 0, 1, 0, 0, 1, 0, 0, 1, 0, 0, 0, …#> $ quality_assurance_engineer <dbl> 0, 0, 0, 0, 0, 0, 0, 0, 0, 0, 0, …#> $ systems_administrator <dbl> 1, 0, 1, 0, 0, 1, 0, 0, 0, 0, 0, …#> $ web_developer <dbl> 0, 0, 0, 1, 1, 1, 0, 1, 0, 1, 1, …initial_split()
"Splits" data randomly into a single testing and a single training set;
extract training and testing sets from an rsplit
set.seed(100) # Important!so_split <- initial_split(stackoverflow, strata = remote)so_train <- training(so_split)so_test <- testing(so_split)Your turn 1
Using the so_train and so_test data sets, how many individuals in our training set are remote? How about in the testing set?
02:00
so_train %>% count(remote)#> # A tibble: 2 x 2#> remote n#> <fct> <int>#> 1 Remote 432#> 2 Not remote 432so_test %>% count(remote)#> # A tibble: 2 x 2#> remote n#> <fct> <int>#> 1 Remote 143#> 2 Not remote 143so_train %>% count(remote)#> # A tibble: 2 x 2#> remote n#> <fct> <int>#> 1 Remote 432#> 2 Not remote 432so_test %>% count(remote)#> # A tibble: 2 x 2#> remote n#> <fct> <int>#> 1 Remote 143#> 2 Not remote 143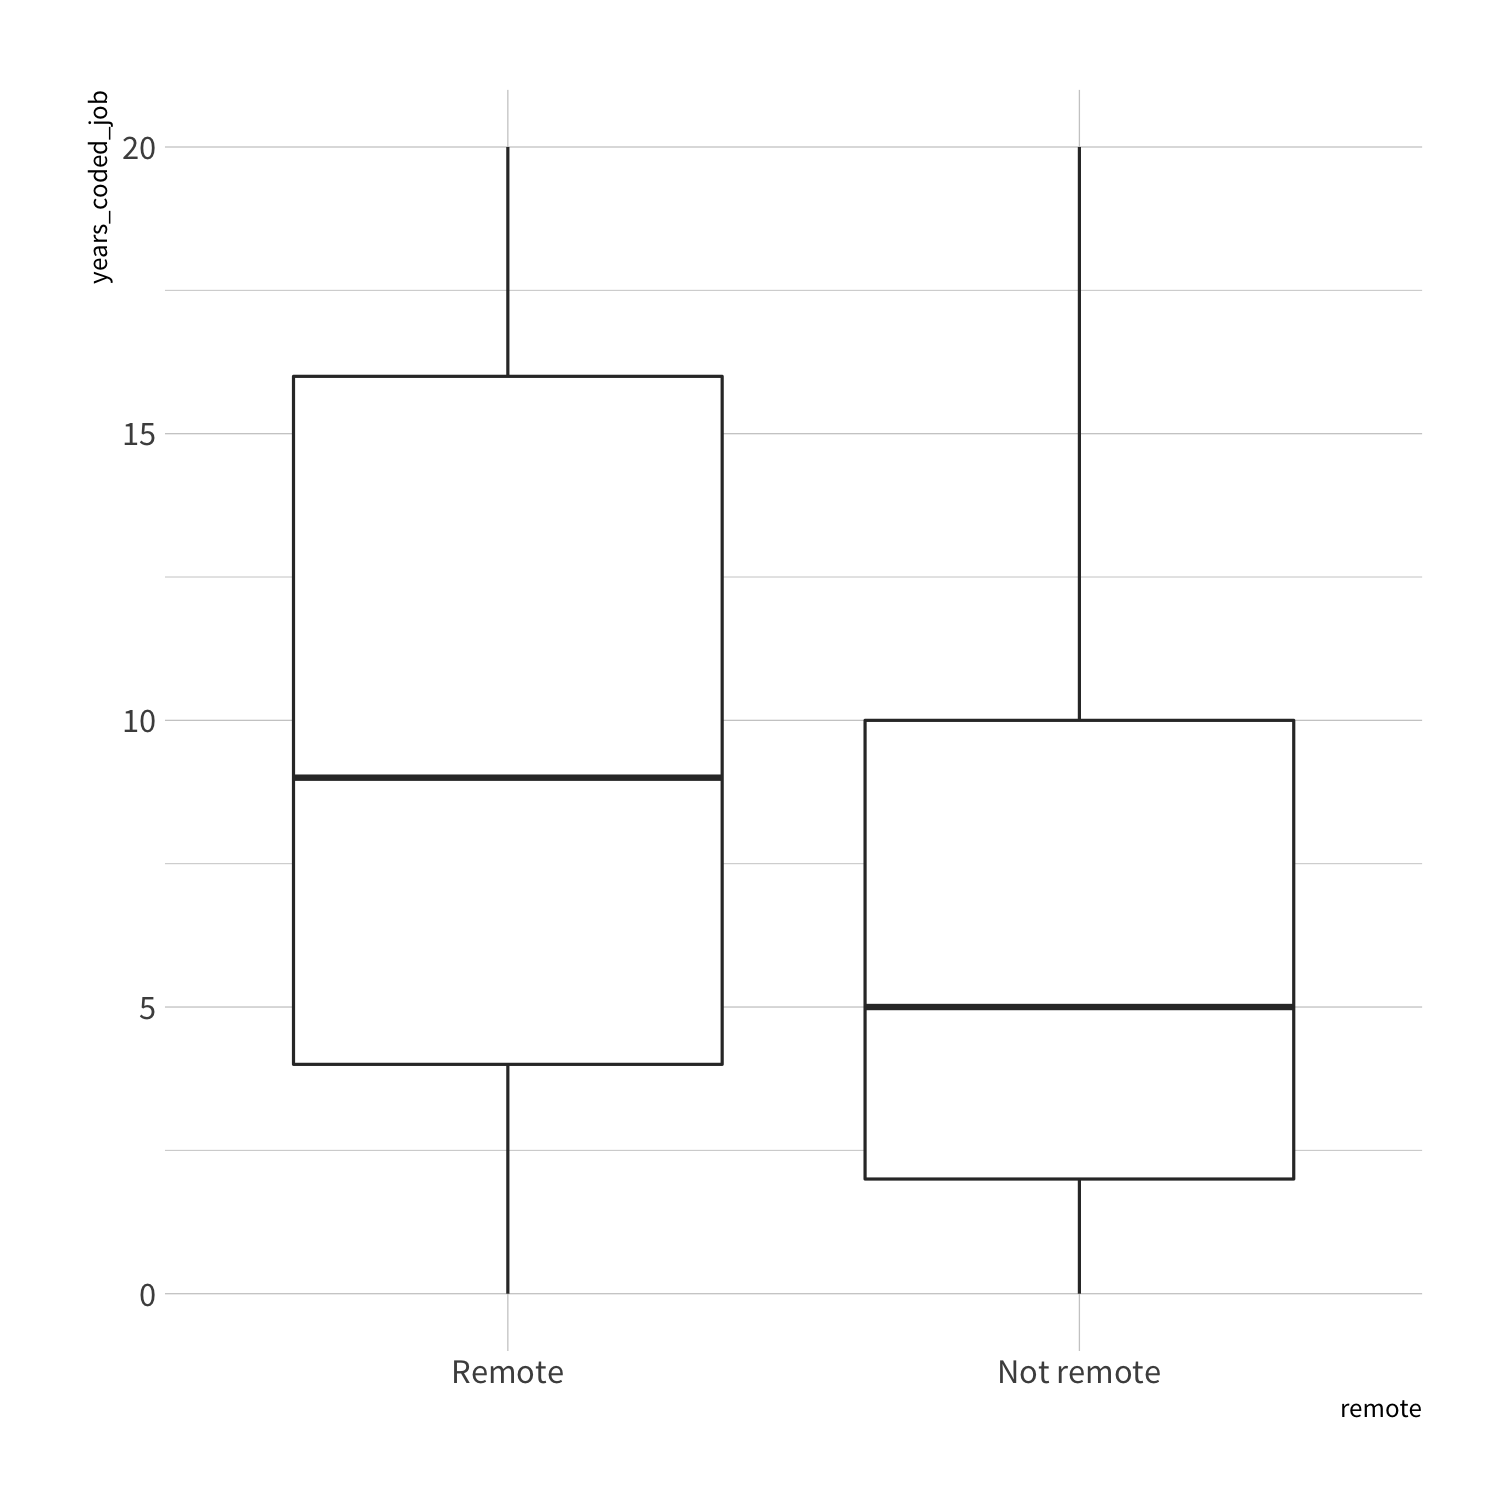
How would we fit a tree with parsnip?

To specify a model with parsnip
1. Pick a model
2. Set the engine
3. Set the mode (if needed)
2. Set the engine
We'll use rpart for building Classification And Regression Trees
set_engine("rpart")3. Set the mode
A character string for the model type (e.g. "classification" or "regression")
set_mode("classification")To specify a model with parsnip
decision_tree() %>% set_engine("rpart") %>% set_mode("classification")Your turn 2
Fill in the blanks. Use the tree_spec model provided and fit() to:
Train a CART-based model with the formula =
remote ~ years_coded_job + salary.Remind yourself what the output looks like!
Predict remote status with the testing data.
Keep
set.seed(100)at the start of your code.
05:00
tree_spec <- decision_tree() %>% set_engine("rpart") %>% set_mode("classification")set.seed(100) # Important!tree_fit <- fit(tree_spec, remote ~ years_coded_job + salary, data = so_train)tree_fit#> parsnip model object#> #> Fit time: 7ms #> n= 864 #> #> node), split, n, loss, yval, (yprob)#> * denotes terminal node#> #> 1) root 864 432 Remote (0.5000000 0.5000000) #> 2) salary>=89196.97 329 103 Remote (0.6869301 0.3130699) *#> 3) salary< 89196.97 535 206 Not remote (0.3850467 0.6149533) #> 6) salary< 6423.433 40 16 Remote (0.6000000 0.4000000) *#> 7) salary>=6423.433 495 182 Not remote (0.3676768 0.6323232) *predict(tree_fit, new_data = so_test)#> # A tibble: 286 x 1#> .pred_class#> <fct> #> 1 Remote #> 2 Remote #> 3 Not remote #> 4 Not remote #> 5 Remote #> 6 Not remote #> 7 Remote #> 8 Not remote #> 9 Remote #> 10 Not remote #> # … with 276 more rowsGoal of Machine Learning
🔨 construct models that
🔮 generate accurate predictions
🆕 for future, yet-to-be-seen data
Goal of Machine Learning
🔨 construct models that
🔮 generate accurate predictions
🆕 for future, yet-to-be-seen data
Goal of Machine Learning
🔨 construct models that
🔮 generate accurate predictions
🆕 for future, yet-to-be-seen data
Goal of Machine Learning
🔨 construct models that
🎯 generate accurate predictions
🆕 for future, yet-to-be-seen data
Your turn 3
Create a data frame of the observed and predicted remote status for the so_test data. Then use count() to count the number of individuals (i.e., rows) by their true and predicted remote status. Answer the following questions:
How many predictions did we make?
How many times is "remote" status predicted?
How many respondents are actually remote?
How many predictions did we get right?
Hint: You can create a 2x2 table using count(var1, var2)
06:00
tree_predict <- predict(tree_fit, new_data = so_test)all_preds <- so_test %>% select(remote) %>% bind_cols(tree_predict)all_preds#> # A tibble: 286 x 2#> remote .pred_class#> <fct> <fct> #> 1 Remote Remote #> 2 Remote Remote #> 3 Remote Not remote #> 4 Remote Not remote #> 5 Remote Remote #> 6 Remote Not remote #> 7 Remote Remote #> 8 Remote Not remote #> 9 Remote Remote #> 10 Remote Not remote #> # … with 276 more rowsall_preds %>% count(.pred_class, truth = remote)#> # A tibble: 4 x 3#> .pred_class truth n#> <fct> <fct> <int>#> 1 Remote Remote 89#> 2 Remote Not remote 40#> 3 Not remote Remote 54#> 4 Not remote Not remote 103conf_mat()
Creates confusion matrix, or truth table, from a data frame with observed and predicted classes.
conf_mat(data, truth = remote, estimate = .pred_class)all_preds %>% conf_mat(truth = remote, estimate = .pred_class)#> Truth#> Prediction Remote Not remote#> Remote 89 40#> Not remote 54 103all_preds %>% conf_mat(truth = remote, estimate = .pred_class) %>% autoplot(type = "heatmap")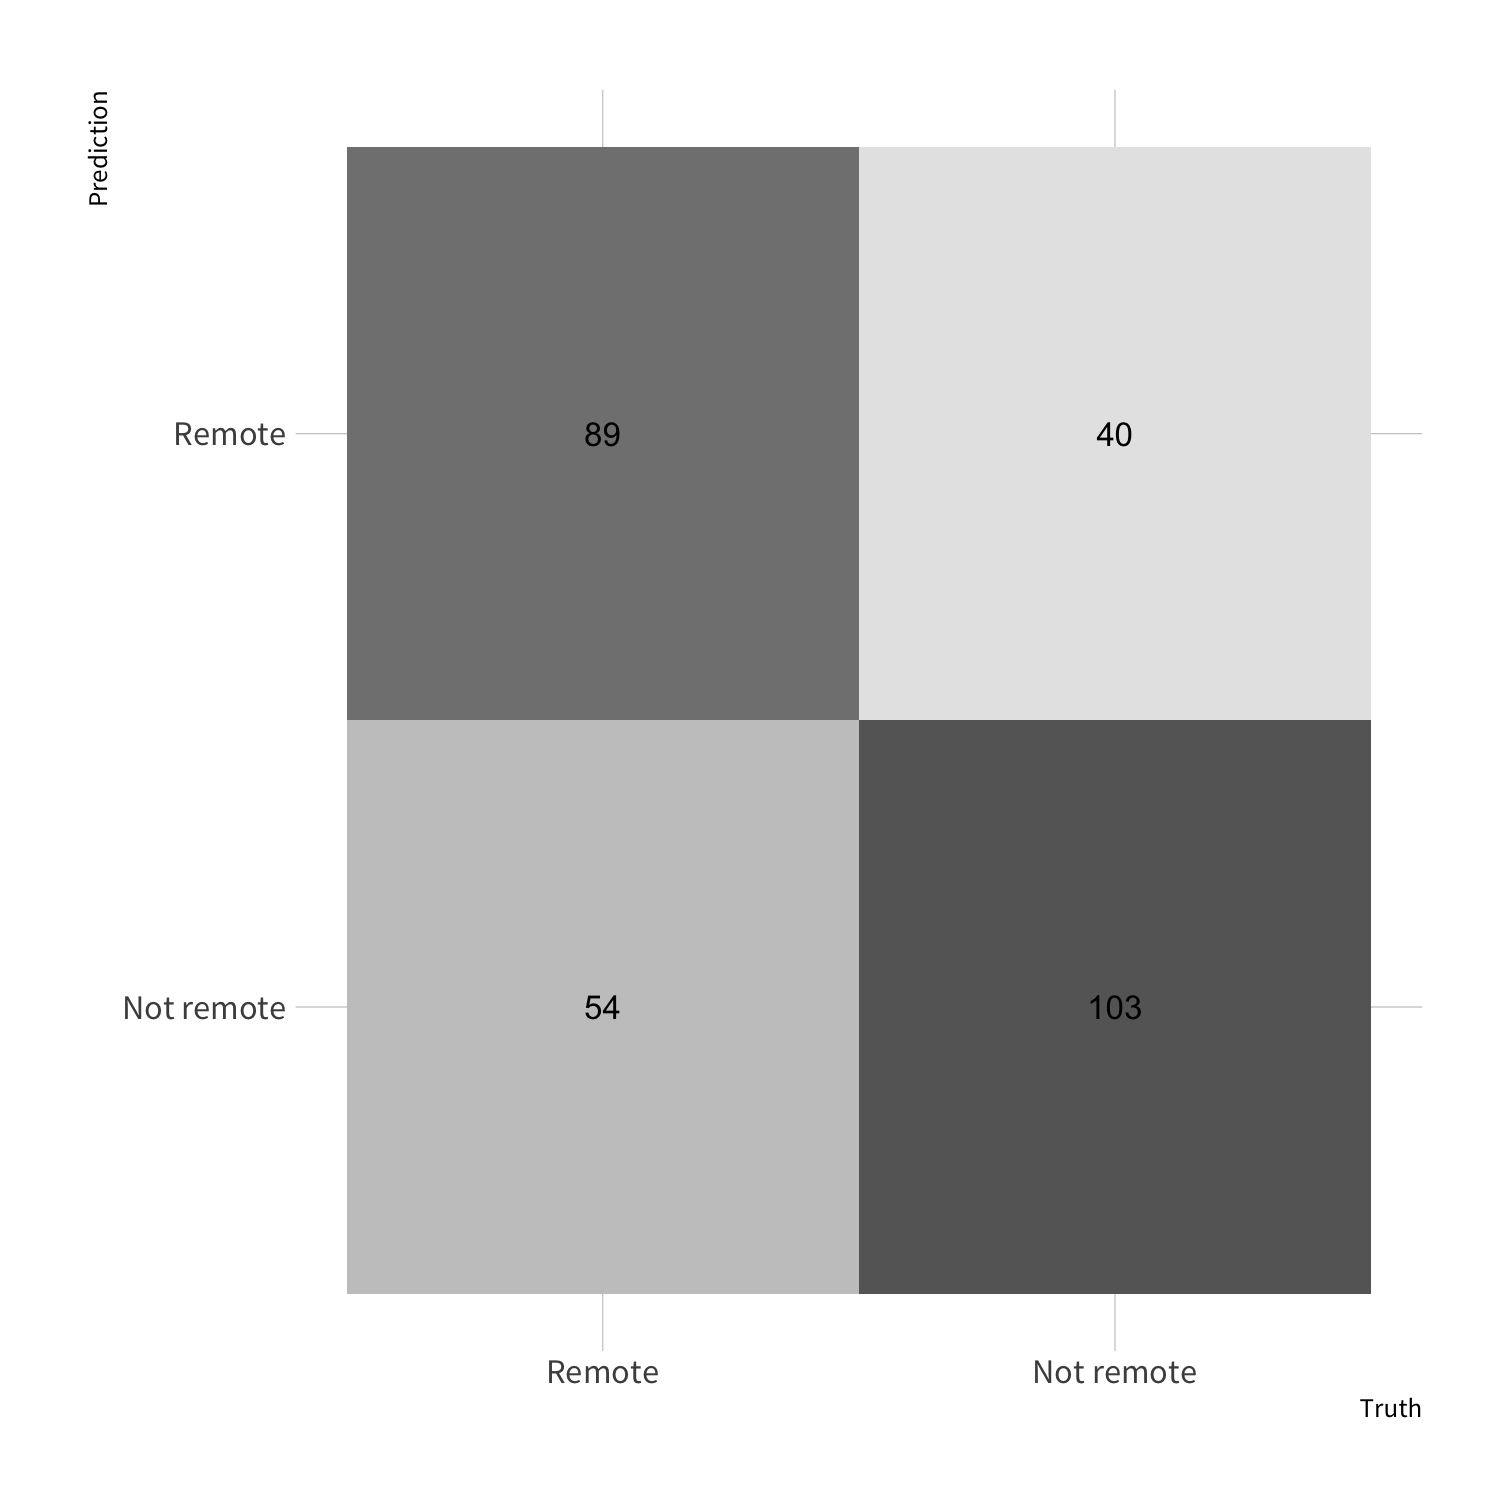
Confusion matrix
Confusion matrix
Confusion matrix
Confusion matrix
Accuracy
Accuracy
Accuracy
Sensitivity vs. Specificity
Sensitivity
Sensitivity
Specificity
Specificity
Metrics
All available metrics are listed at https://yardstick.tidymodels.org/articles/metric-types.html#metrics
Calculating metrics
accuracy(all_preds, truth = remote, estimate = .pred_class)#> # A tibble: 1 x 3#> .metric .estimator .estimate#> <chr> <chr> <dbl>#> 1 accuracy binary 0.671sensitivity(all_preds, truth = remote, estimate = .pred_class)#> # A tibble: 1 x 3#> .metric .estimator .estimate#> <chr> <chr> <dbl>#> 1 sens binary 0.622specificity(all_preds, truth = remote, estimate = .pred_class)#> # A tibble: 1 x 3#> .metric .estimator .estimate#> <chr> <chr> <dbl>#> 1 spec binary 0.720metric_set()
Combine multiple metrics functions together.
so_metrics <- metric_set(accuracy, sensitivity, specificity)so_metrics(all_preds, truth = remote, estimate = .pred_class)#> # A tibble: 3 x 3#> .metric .estimator .estimate#> <chr> <chr> <dbl>#> 1 accuracy binary 0.671#> 2 sens binary 0.622#> 3 spec binary 0.720roc_curve()
Takes predictions, returns a tibble with probabilities.
roc_curve(all_preds, truth = remote, estimate = .pred_Remote)Truth = the observed class
Estimate = the probability of the target response
We don't have .pred_Remote. How do we get that?
all_preds <- so_test %>% select(remote) %>% bind_cols(predict(tree_fit, new_data = so_test)) %>% bind_cols(predict(tree_fit, new_data = so_test, type = "prob"))all_preds#> # A tibble: 286 x 4#> remote .pred_class .pred_Remote `.pred_Not remote`#> <fct> <fct> <dbl> <dbl>#> 1 Remote Remote 0.687 0.313#> 2 Remote Remote 0.687 0.313#> 3 Remote Not remote 0.368 0.632#> 4 Remote Not remote 0.368 0.632#> 5 Remote Remote 0.687 0.313#> 6 Remote Not remote 0.368 0.632#> 7 Remote Remote 0.687 0.313#> 8 Remote Not remote 0.368 0.632#> 9 Remote Remote 0.687 0.313#> 10 Remote Not remote 0.368 0.632#> # … with 276 more rowsroc_curve()
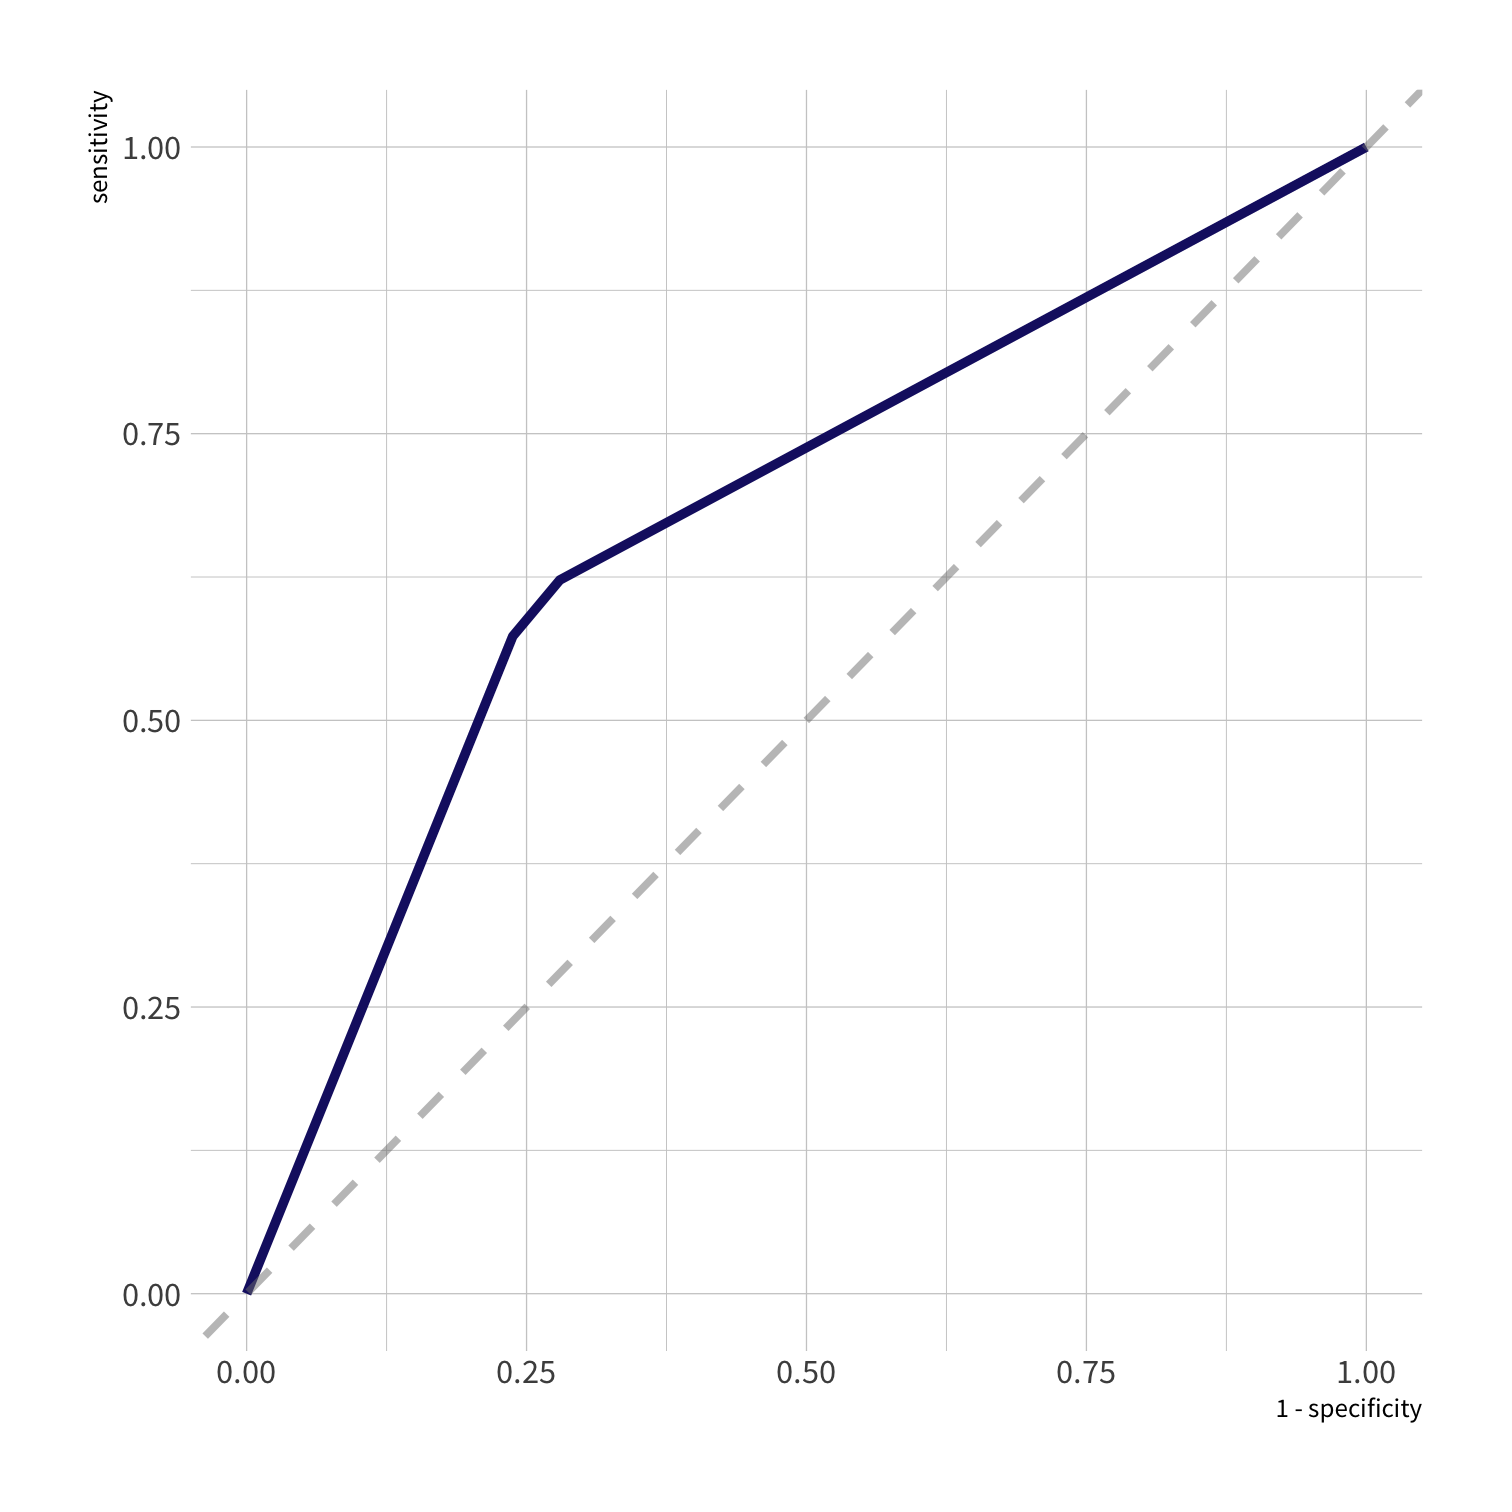
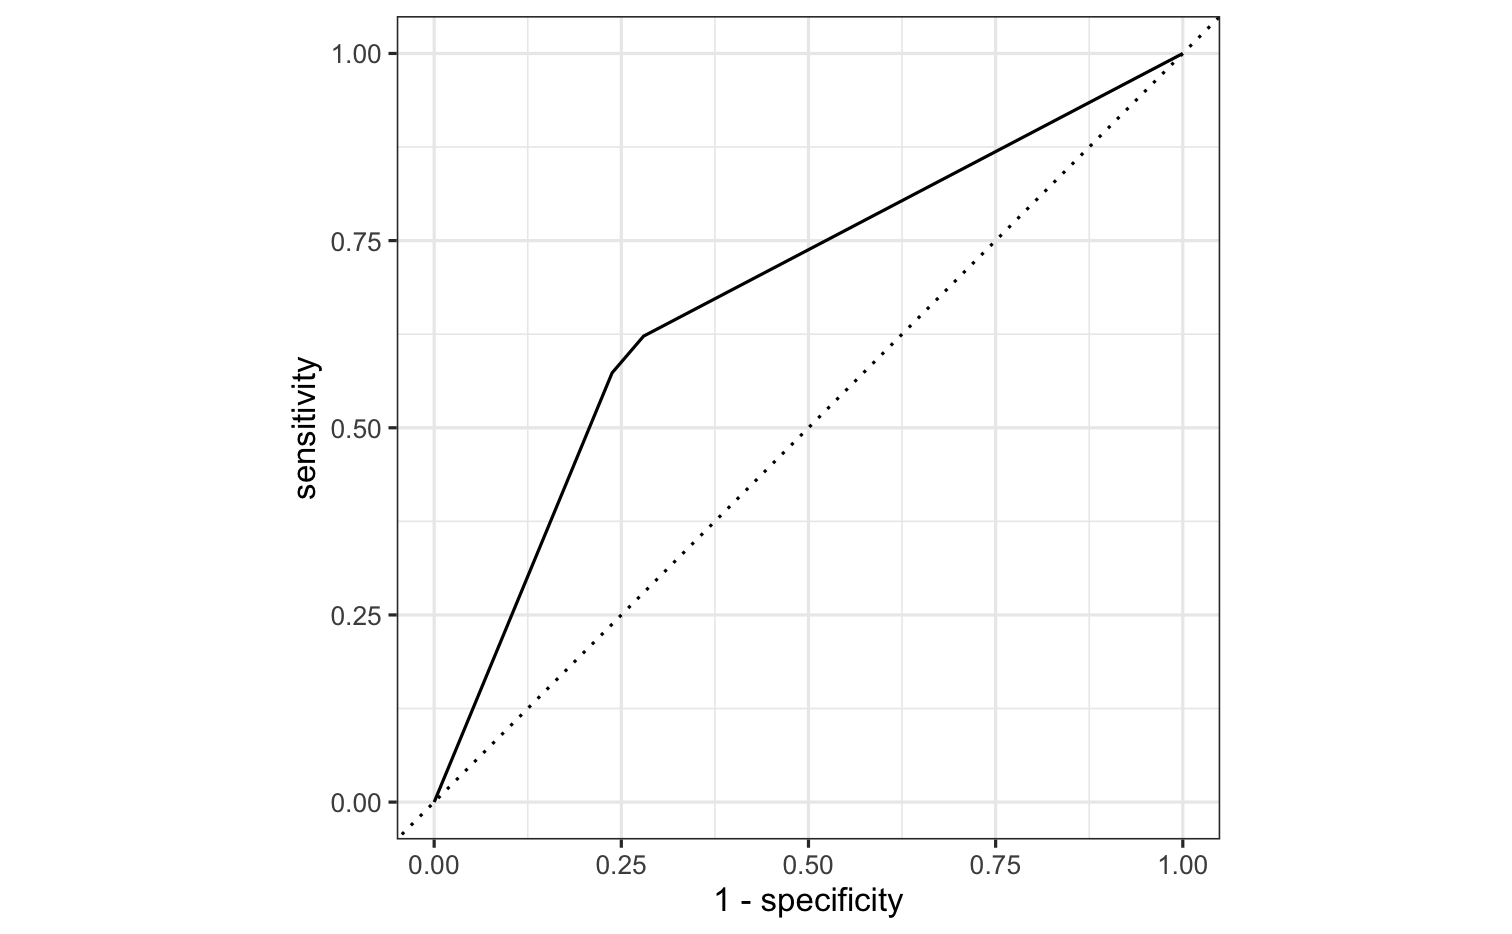
roc_curve(all_preds, truth = remote, estimate = .pred_Remote)#> # A tibble: 5 x 3#> .threshold specificity sensitivity#> <dbl> <dbl> <dbl>#> 1 -Inf 0 1 #> 2 0.368 0 1 #> 3 0.6 0.720 0.622#> 4 0.687 0.762 0.573#> 5 Inf 1 0.threshold = probability threshold needed to place an individual in the class.
Your turn 4
Build the necessary data frame, and use roc_curve() to calculate the data needed to construct the full ROC curve.
What is the necessary threshold for achieving specificity >.75?
05:00
all_preds <- so_test %>% select(remote) %>% bind_cols(predict(tree_fit, new_data = so_test)) %>% bind_cols(predict(tree_fit, new_data = so_test, type = "prob"))roc_curve(all_preds, truth = remote, estimate = .pred_Remote)#> # A tibble: 5 x 3#> .threshold specificity sensitivity#> <dbl> <dbl> <dbl>#> 1 -Inf 0 1 #> 2 0.368 0 1 #> 3 0.6 0.720 0.622#> 4 0.687 0.762 0.573#> 5 Inf 1 0For specificity of .75, we need a threshold of .687.
roc_curve(all_preds, truth = remote, estimate = .pred_Remote) %>% autoplot()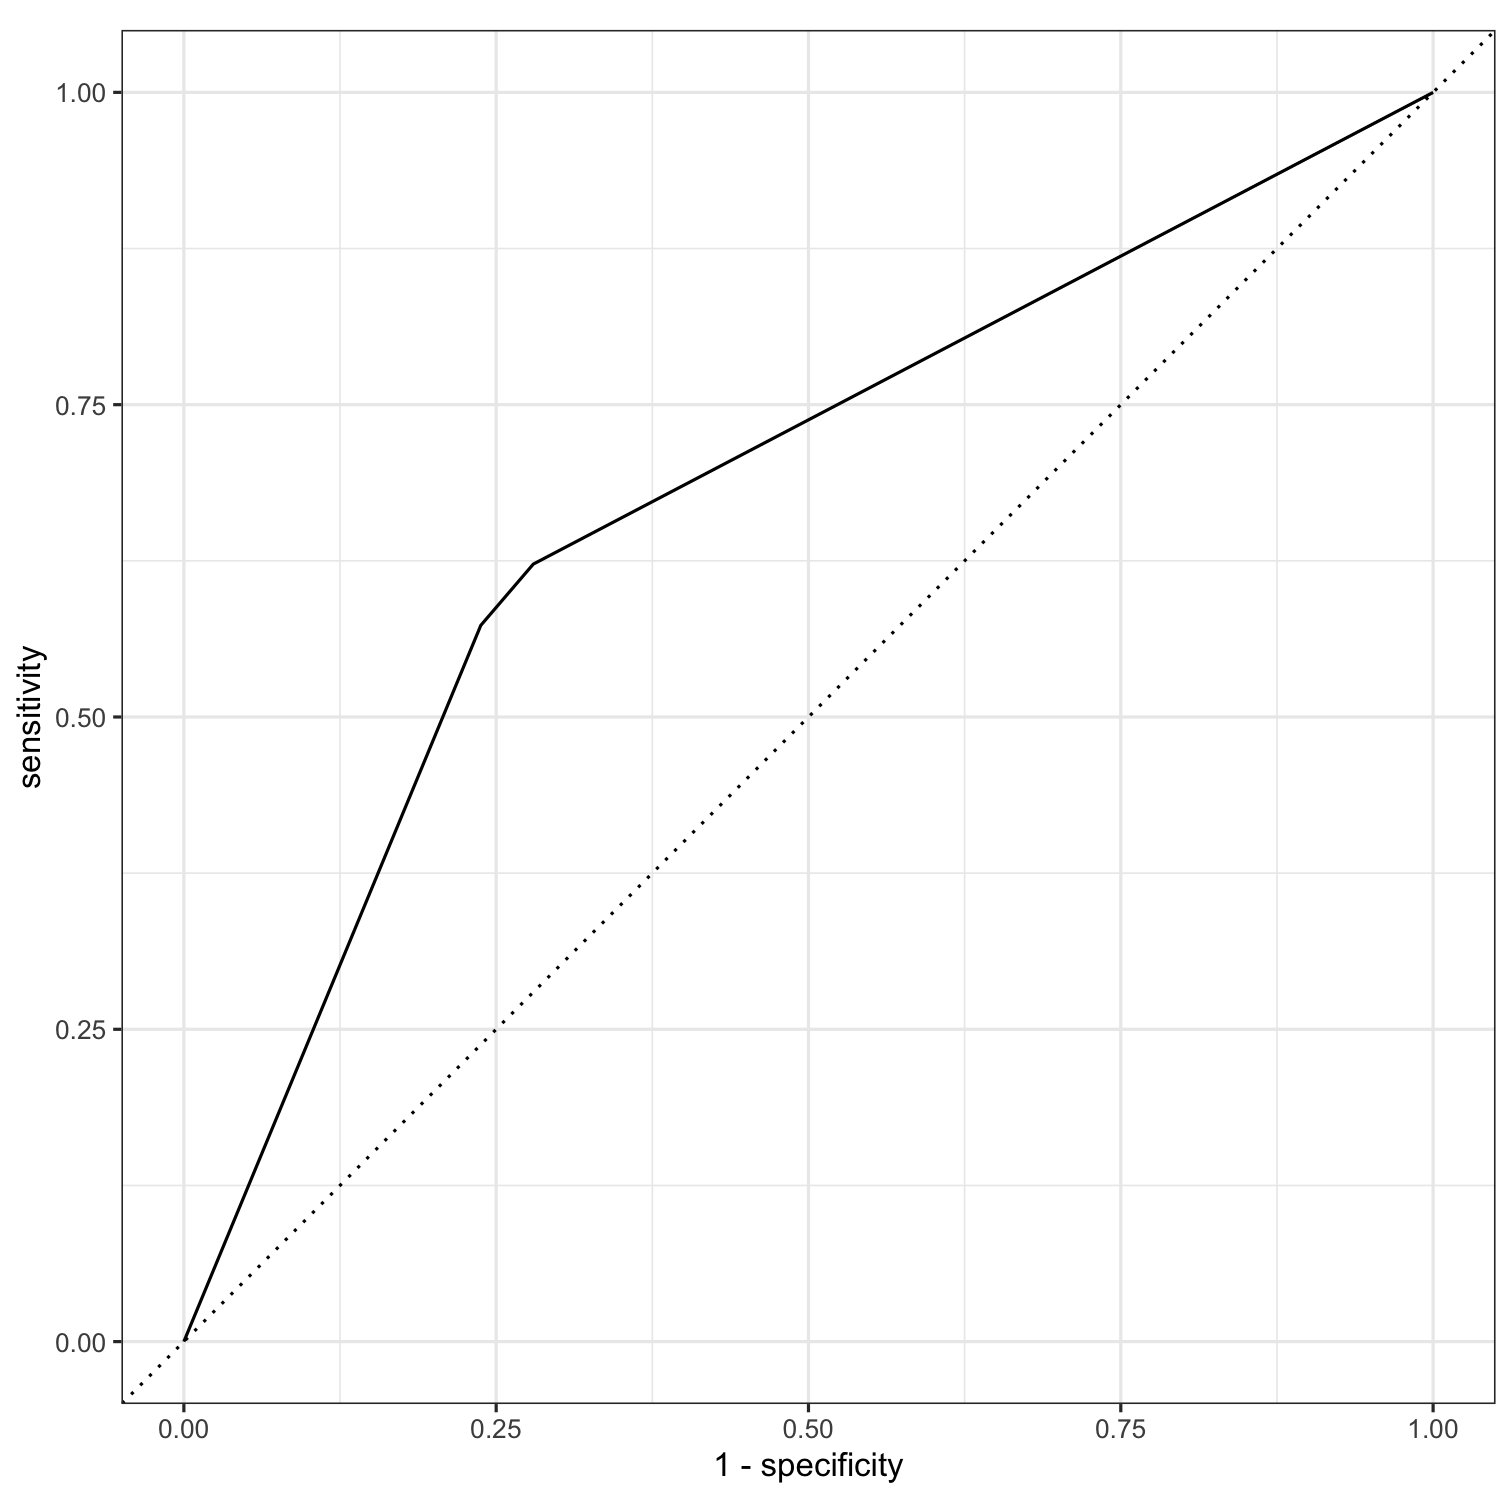
Area under the curve
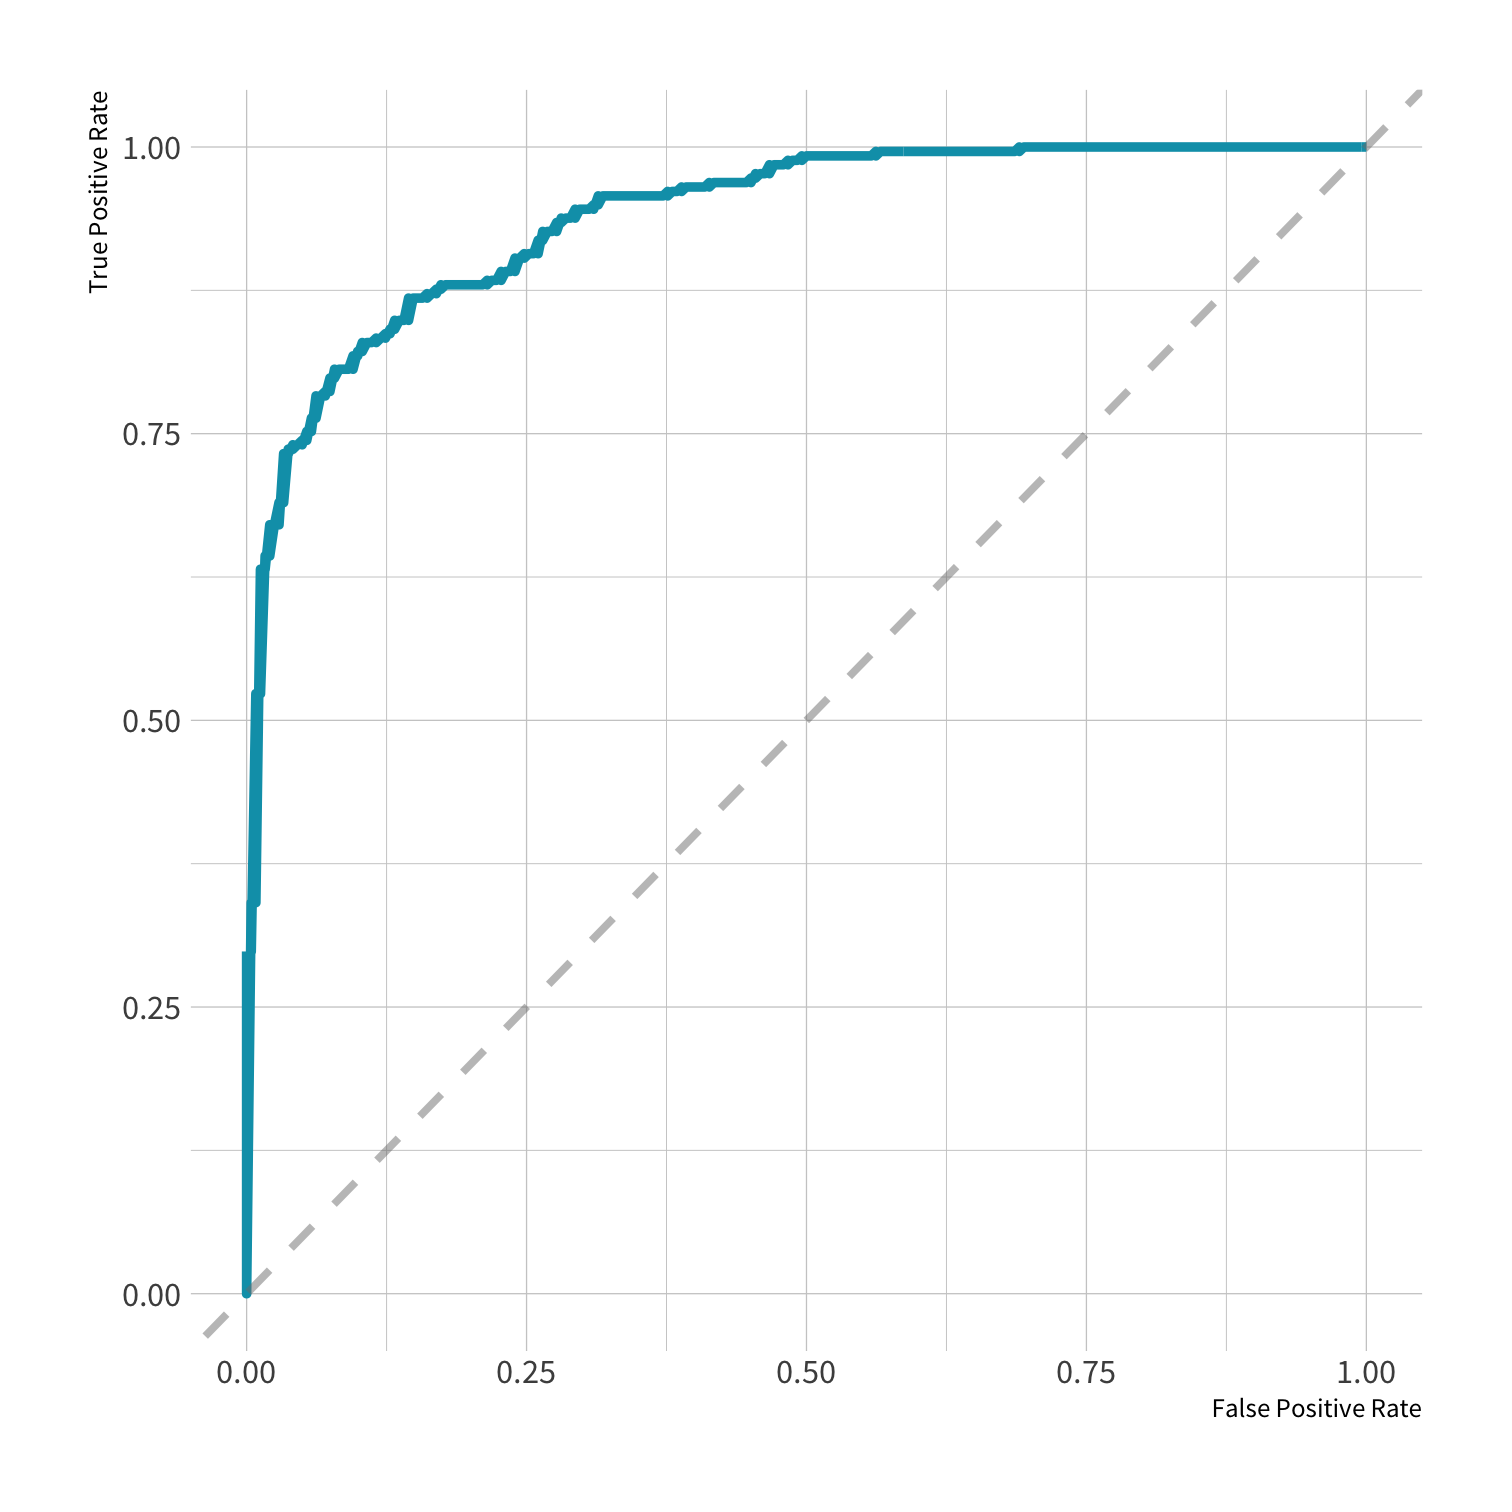
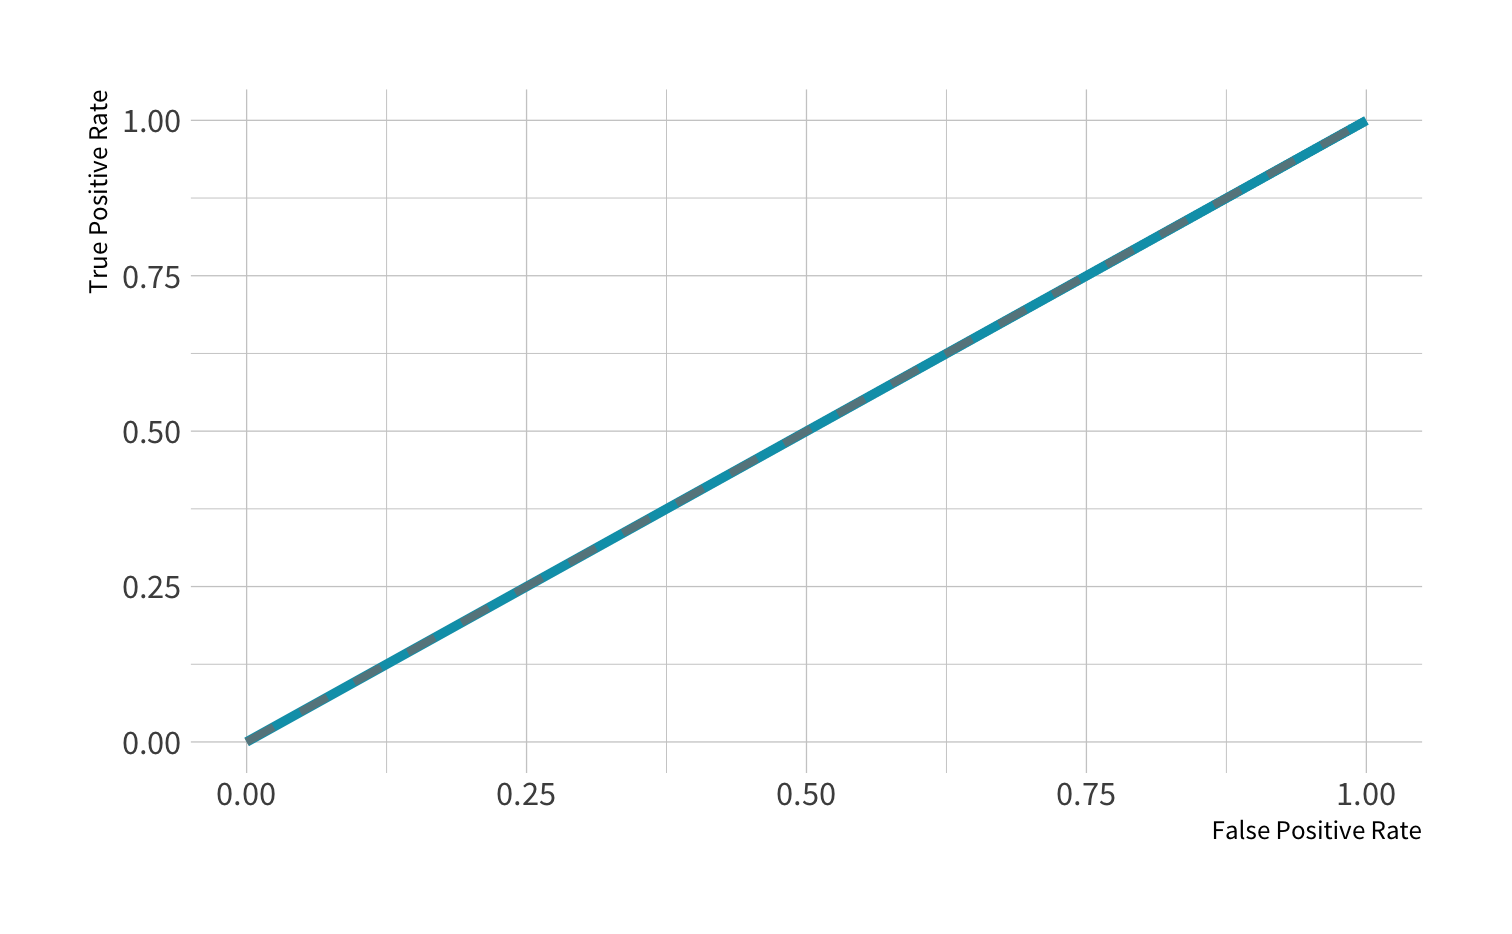
AUC = 0.5: random guessing
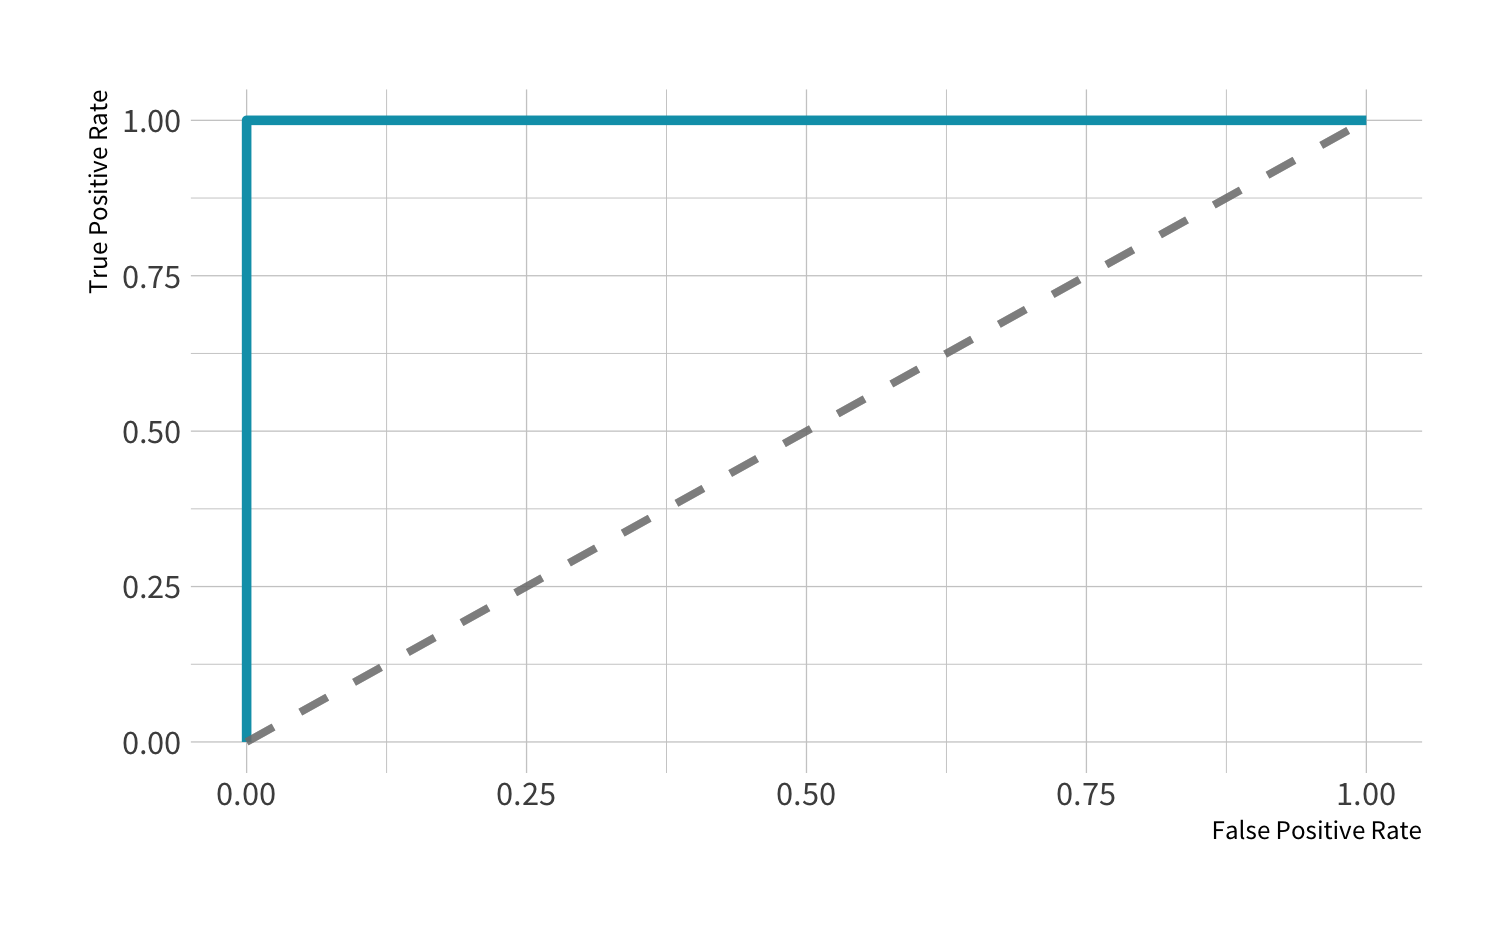
AUC = 1: perfect classifer
In general AUC of above 0.8 considered "good"
{yardstick} metric:
roc_auc()
ROC curve: Guessing
ROC curve: Perfect
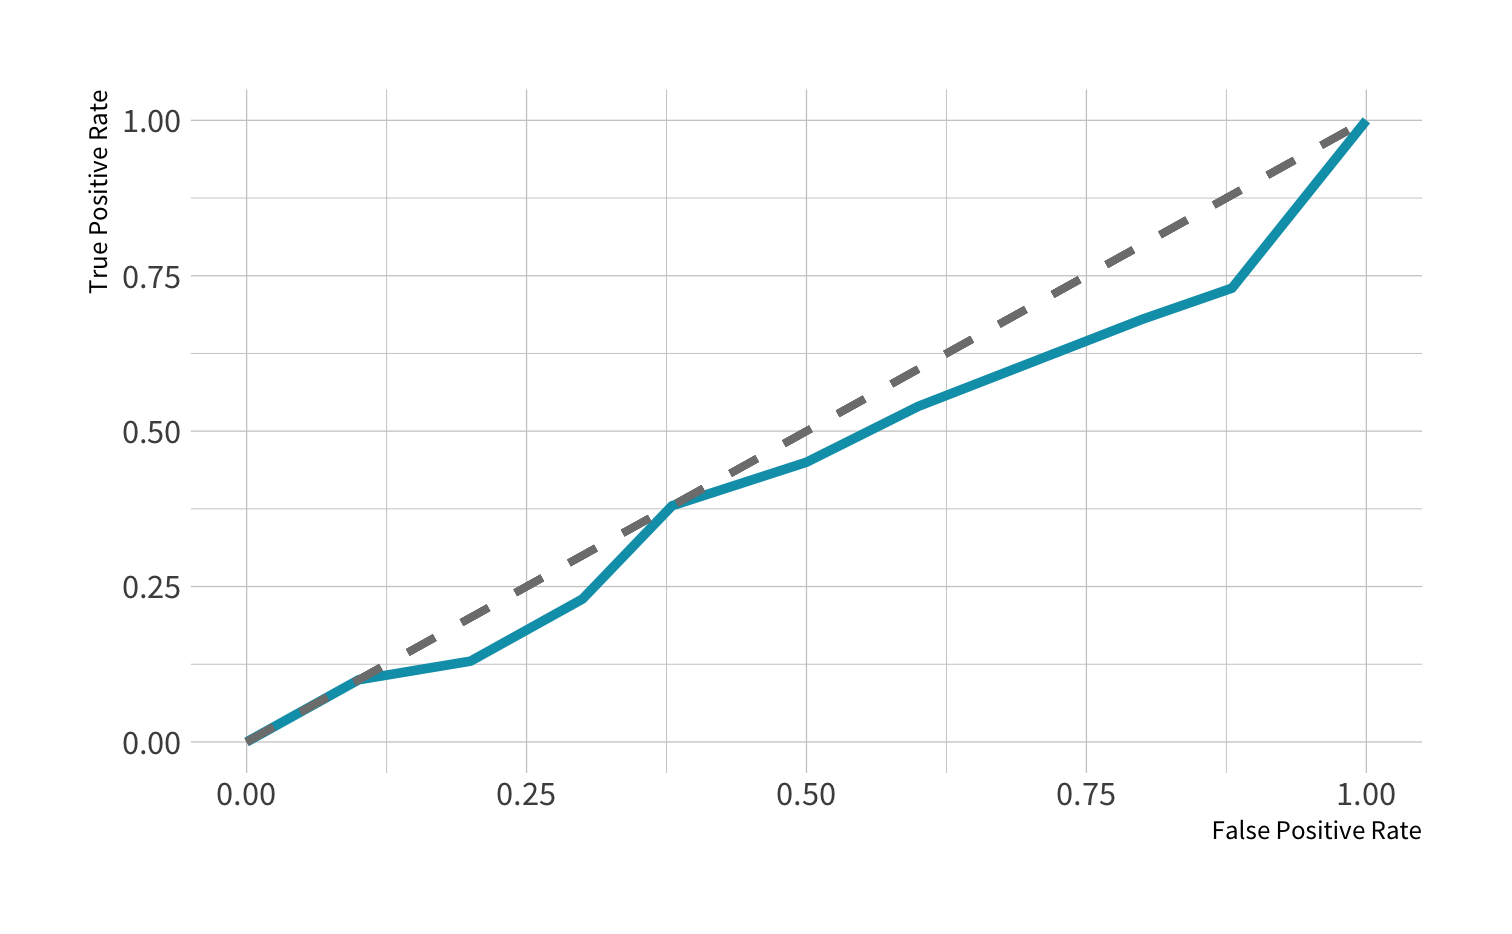
ROC curve: Poor
ROC curve: OK
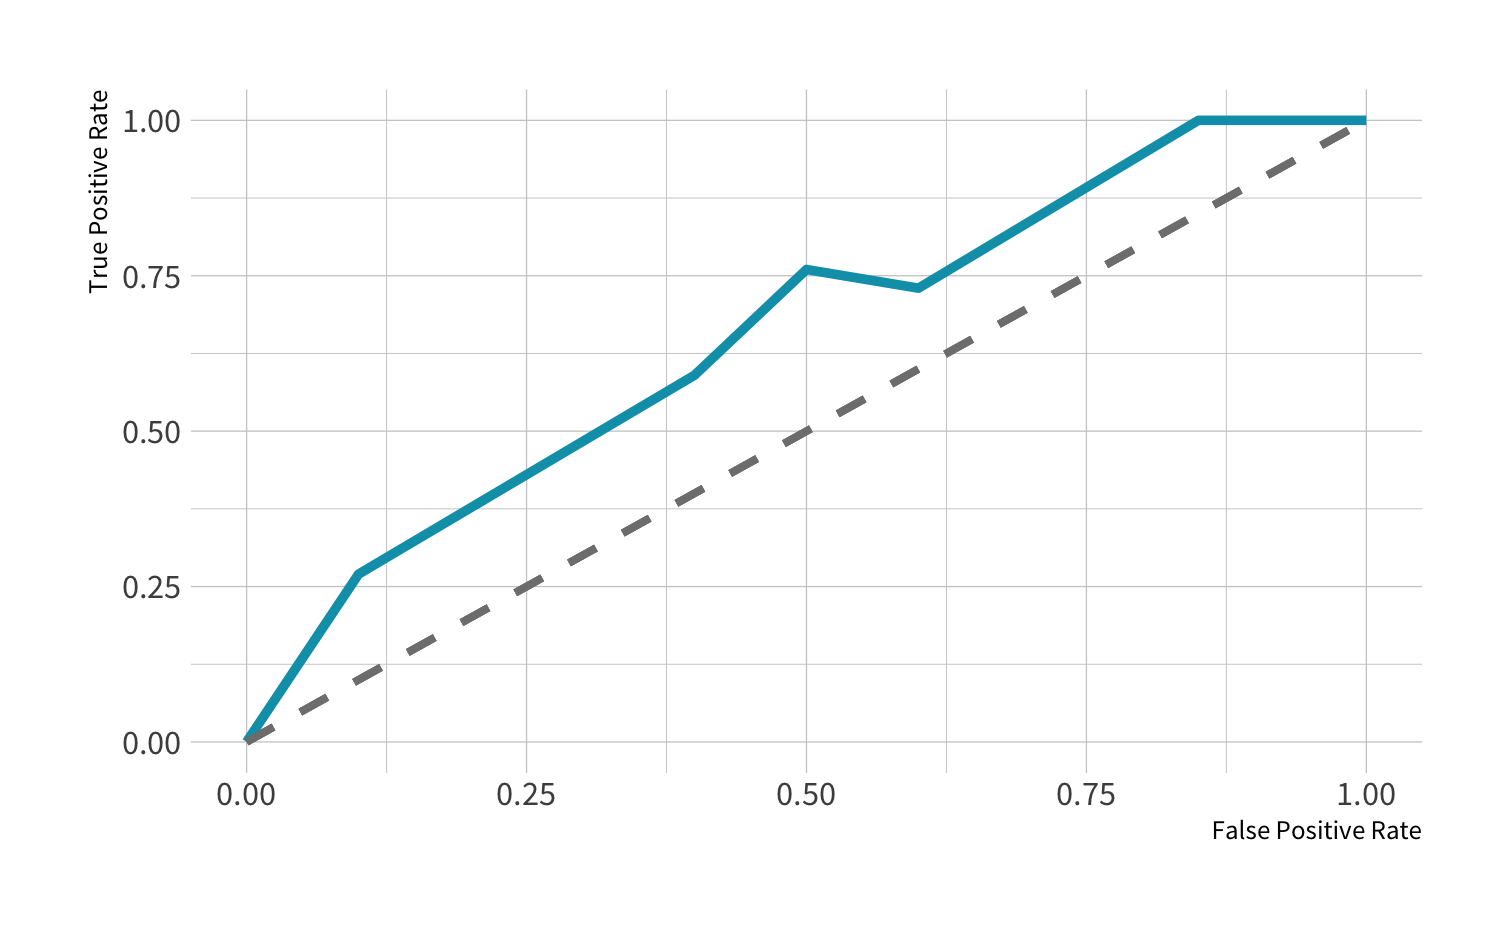
ROC curve: Good
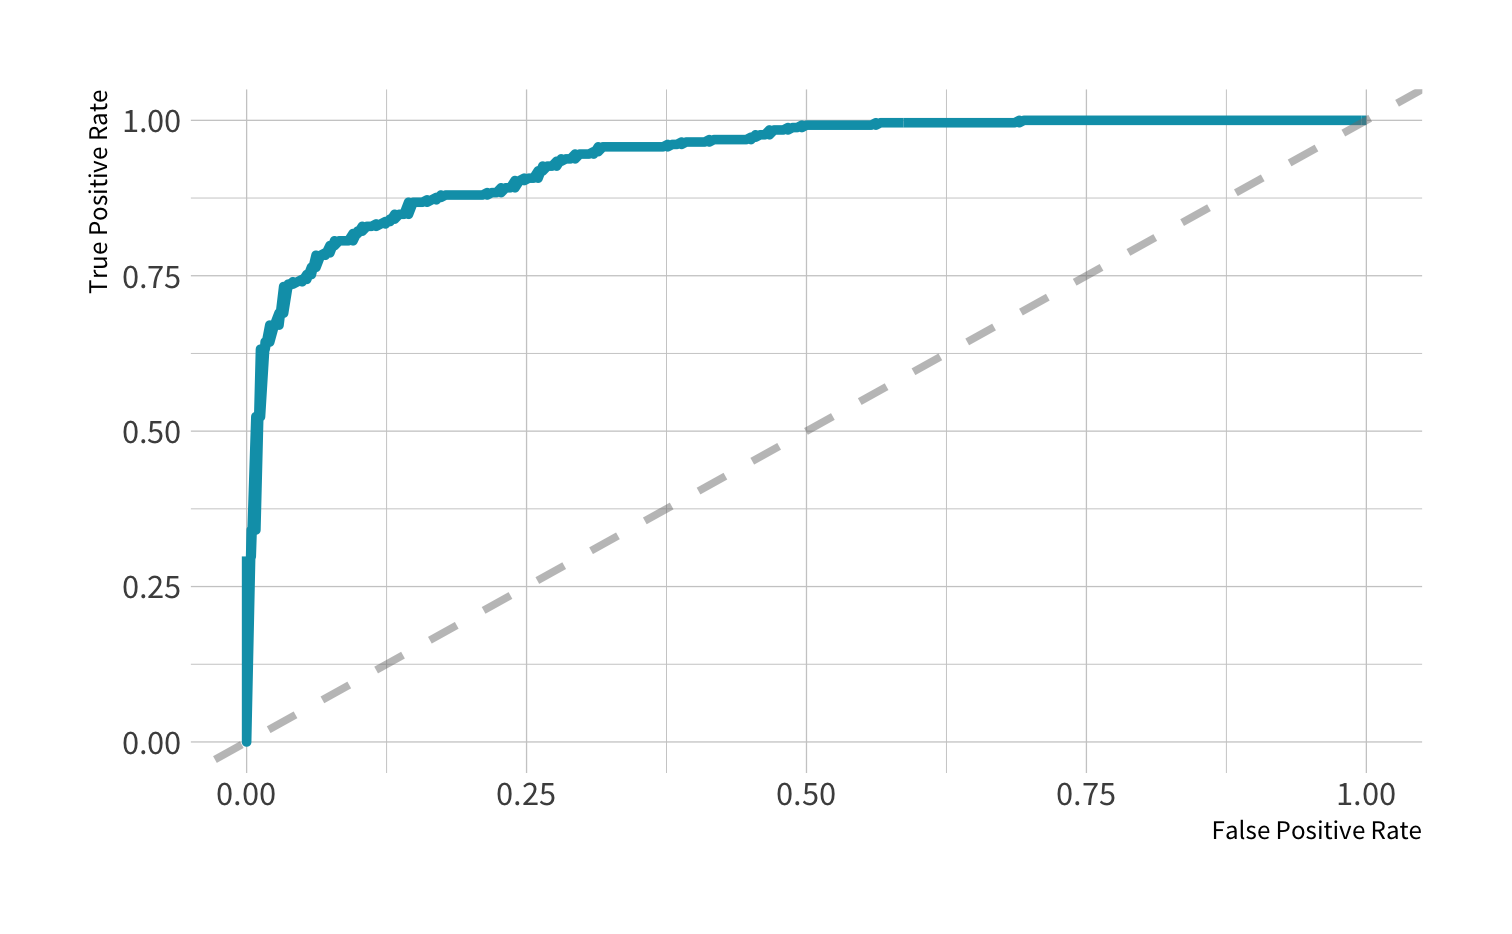
Your turn 5
Use roc_auc() to calculate the area under the ROC curve. Then plot the ROC curve using autoplot().
05:00
Classification

Tidy Data Science with the Tidyverse and Tidymodels
W. Jake Thompson
https://tidyds-2021.wjakethompson.com · https://bit.ly/tidyds-2021
Tidy Data Science with the Tidyverse and Tidymodels is licensed under a Creative Commons Attribution 4.0 International License.

